Lauderdale Lakes: Fire Incidents, Florida (FL)
Where are fire incidents reported in Lauderdale Lakes, FL
Something went wrong! Please refresh the page.
| Fire incidents reported | |
|---|---|
| Sreet name | Count |
| 36TH ST | 246 |
| SR 7 | 244 |
| SOMERSET DR | 230 |
| 21ST ST | 212 |
| OAKLAND PARK | 206 |
| 24TH CT | 120 |
| 31ST AVE | 80 |
| 47TH TER | 76 |
| OAKLAND PARK BLVD | 62 |
| 39TH TER | 54 |
| 30TH TER | 52 |
| 41ST ST | 48 |
| 34TH ST | 46 |
| 30TH ST | 44 |
| 49TH AVE | 44 |
| 39TH WAY | 40 |
| 35TH AVE | 38 |
| 36 TH ST | 38 |
| 29TH ST | 36 |
| 42ND ST | 30 |
| 37TH TER | 28 |
| 19TH ST | 26 |
| 37TH AVE | 24 |
| 39TH ST | 24 |
| 48TH AVE | 24 |
| 50TH AVE | 24 |
| 43RD ST | 22 |
| 52ND AVE | 22 |
| 32ND CT | 20 |
| 33RD AVE | 20 |
2002 - 2018 National Fire Incident Reporting System (NFIRS) incidents
- Incident types reported to NFIRS in Lauderdale Lakes, FL
- 22,48167.9%Rescue & EMS
- 3,75611.3%Good Intent Call
- 2,1796.6%Service Call
- 2,0816.3%False Alarm
- 1,4374.3%Fire
- 1,1623.5%Hazardous Condition
- Fire incident types reported to NFIRS in Lauderdale Lakes, FL
- 81056.4%Structure Fires
- 29520.5%Mobile Property/Vehicle Fires
- 25117.5%Outside Fires
- 815.6%Other
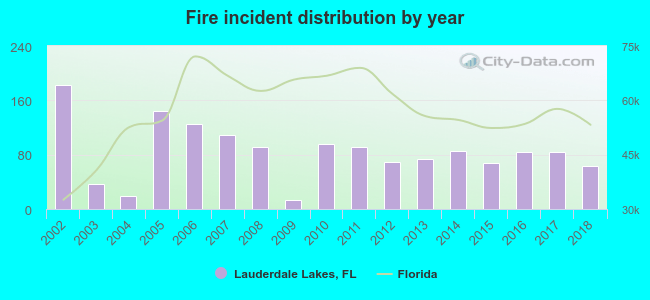 According to the data from the years 2002 - 2018 the average number of fire incidents per year is 85. The highest number of reported fires - 182 took place in 2002, and the least - 13 in 2009. The data has a decreasing trend.
The average number of yearly fire incidents per 10k residents in Lauderdale Lakes, FL compared to nearest cities:
(Note: Based on data for the last 3 years, including only cities with population 5,000 and above)
| Lauderdale Lakes: | 22.5 |
| Lauderhill: | 24.5 |
| North Lauderdale: | 19.9 |
| Oakland Park: | 32.1 |
| Tamarac: | 11.5 |
| Wilton Manors: | 22.3 |
| Plantation: | 10.4 |
| Fort Lauderdale: | 31.2 |
| Margate: | 17.2 |
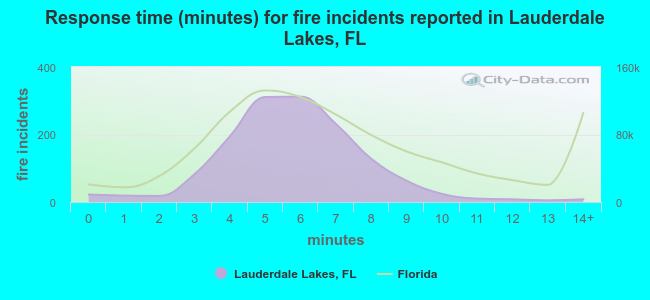 The median response time based on all reported fire incidents is 6 minutes. This is similar to the Florida median value.
The median response time in Lauderdale Lakes, FL compared to nearest cities:
(Note: Based on data for all years, including only cities with at least 500 fire incidents)
| Lauderdale Lakes: | 6 minutes |
| Lauderhill: | 6 minutes |
| North Lauderdale: | 5 minutes |
| Oakland Park: | 5 minutes |
| Tamarac: | 6 minutes |
| Plantation: | 7 minutes |
| Fort Lauderdale: | 5 minutes |
| Margate: | 5 minutes |
| Sunrise: | 6 minutes |
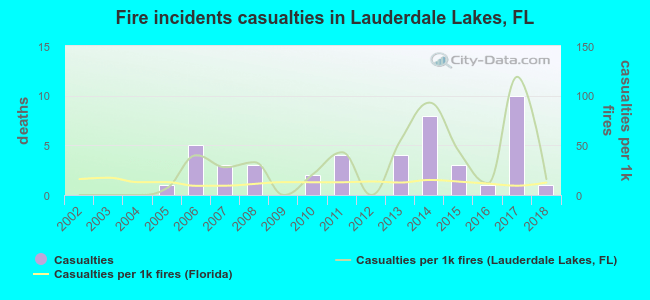 According to the reports from the years 2002 - 2018 the average number of fire-related yearly casualties is 3. The highest number of casualties - 10 took place in 2017, and the lowest - 0 in 2002. The data has an increasing trend.
The average number of injuries per 1,000 fire incidents is 30. This indicator was the highest - 119 in 2017, and the lowest 0 in 2002. The trend for casualties per 1,000 fires is increasing. Compared to the state value the number of injuries per 1,000 incidents is much higher.
According to the reports from the years 2002 - 2018 the average number of fire-related yearly casualties is 3. The highest number of casualties - 10 took place in 2017, and the lowest - 0 in 2002. The data has an increasing trend.
The average number of injuries per 1,000 fire incidents is 30. This indicator was the highest - 119 in 2017, and the lowest 0 in 2002. The trend for casualties per 1,000 fires is increasing. Compared to the state value the number of injuries per 1,000 incidents is much higher.Casualties per 1,000 incidents in Lauderdale Lakes, FL compared to nearest cities:
(Note: Based on data for all years, including only cities with at least 500 fire incidents)
| Lauderdale Lakes: | 31.3 |
| Lauderhill: | 39.2 |
| North Lauderdale: | 7.7 |
| Oakland Park: | 0.5 |
| Tamarac: | 7.1 |
| Plantation: | 6.6 |
| Fort Lauderdale: | 9.8 |
| Margate: | 25.8 |
| Sunrise: | 32.6 |
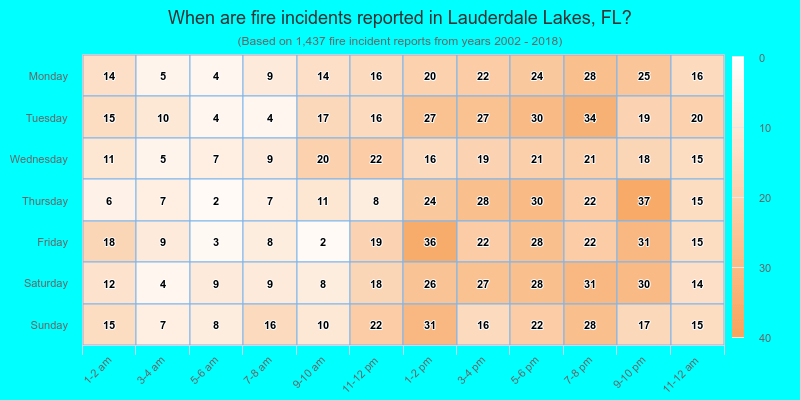
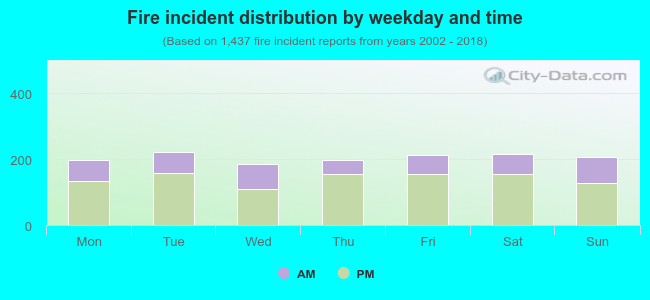 30.6% incidents where reported in the morning and 69.4% in the evening. The most fires (15.5%) took place on Tuesday, and the least (12.8%) on Wednesday.
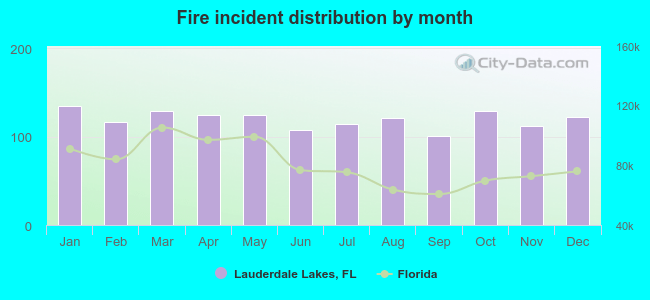 Based on the 1,437 incident reports from years 2002 - 2018 most fires (9.4%) took place during January, and the least (7.0%) in September.
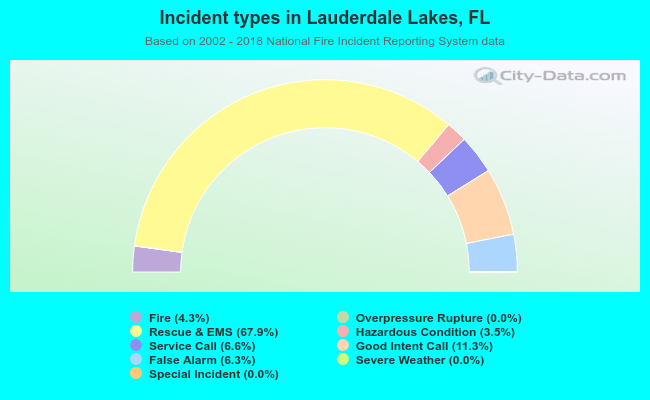 Out of all 33,117 cases reported during the years 2002 - 2018, the most belonged to the categories: Rescue & EMS (67.9%), Good Intent Call (11.3%), and Service Call (6.6%).
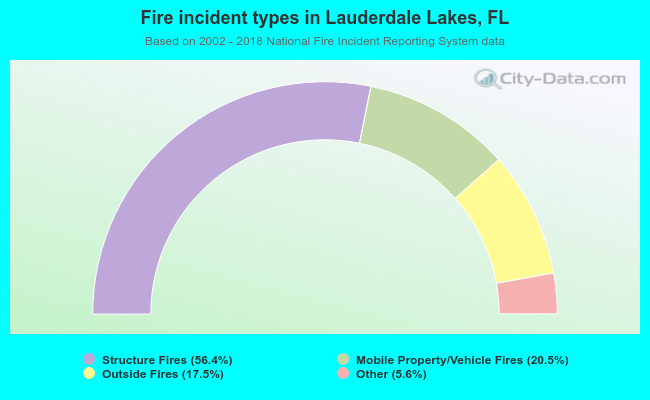 When looking into fire subcategories, the most incidents belonged to: Structure Fires (56.4%), and Mobile Property/Vehicle Fires (20.5%).