Lauderhill: Fire Incidents, Florida (FL)
Where are fire incidents reported in Lauderhill, FL
Something went wrong! Please refresh the page.
| Fire incidents reported | |
|---|---|
| Sreet name | Count |
| 56TH AVE | 474 |
| 19TH ST | 316 |
| SR 7 | 280 |
| INVERRARY BLVD | 254 |
| 55TH AVE | 204 |
| OAKLAND PARK | 200 |
| INVERRARY DR | 182 |
| SUNRISE BLVD | 132 |
| 43RD TER | 124 |
| 21ST ST | 122 |
| UNIVERSITY DR | 122 |
| 46TH AVE | 118 |
| 16TH ST | 112 |
| 18TH ST | 108 |
| 31ST AVE | 106 |
| 42ND TER | 98 |
| COMMERCIAL BLVD | 94 |
| 44TH ST | 82 |
| 28TH ST | 70 |
| FALLS CIRCLE DR | 66 |
| 27TH CT | 58 |
| 41ST AVE | 58 |
| 58TH AVE | 50 |
| ENVIRON BLVD | 50 |
| 18TH CT | 48 |
| ROCK ISLAND RD | 46 |
| 23RD ST | 44 |
| 43RD AVE | 44 |
| 49TH AVE | 42 |
| 50TH ST | 40 |
2002 - 2018 National Fire Incident Reporting System (NFIRS) incidents
- Incident types reported to NFIRS in Lauderhill, FL
- 47,89666.5%Rescue & EMS
- 10,69914.8%Good Intent Call
- 4,1305.7%False Alarm
- 3,6795.1%Service Call
- 3,0654.3%Fire
- 2,5283.5%Hazardous Condition
- Fire incident types reported to NFIRS in Lauderhill, FL
- 1,65253.9%Structure Fires
- 59019.2%Mobile Property/Vehicle Fires
- 57418.7%Outside Fires
- 2498.1%Other
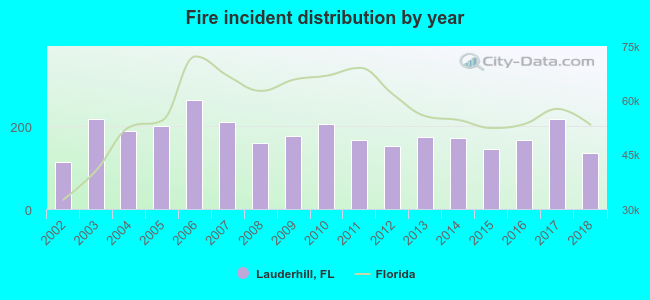 According to the data from the years 2002 - 2018 the average number of fire incidents per year is 180. The highest number of reported fires - 263 took place in 2006, and the least - 113 in 2002. The data has an increasing trend.
The average number of yearly fire incidents per 10k residents in Lauderhill, FL compared to nearest cities:
(Note: Based on data for the last 3 years, including only cities with population 5,000 and above)
| Lauderhill: | 24.5 |
| Lauderdale Lakes: | 22.5 |
| Tamarac: | 11.5 |
| Plantation: | 10.4 |
| Sunrise: | 16.0 |
| North Lauderdale: | 19.9 |
| Oakland Park: | 32.1 |
| Margate: | 17.2 |
| Wilton Manors: | 22.3 |
 The median response time based on all reported fire incidents is 6 minutes. This is similar to the Florida median value.
The median response time in Lauderhill, FL compared to nearest cities:
(Note: Based on data for all years, including only cities with at least 500 fire incidents)
| Lauderhill: | 6 minutes |
| Lauderdale Lakes: | 6 minutes |
| Tamarac: | 6 minutes |
| Plantation: | 7 minutes |
| Sunrise: | 6 minutes |
| North Lauderdale: | 5 minutes |
| Oakland Park: | 5 minutes |
| Margate: | 5 minutes |
| Fort Lauderdale: | 5 minutes |
 According to the reports from the years 2002 - 2018 the average number of fire-related yearly deaths is 0. The highest number of deaths - 2 took place in 2008, and the lowest - 0 in 2002. The data has a constant trend.
The average number of deaths per 1,000 fire incidents is 2. This indicator was the highest - 13 in 2008, and the lowest 0 in 2002. The trend for deaths per 1,000 fires is increasing. Compared to the Florida value the number of deaths per 1,000 fire incidents is higher.
According to the reports from the years 2002 - 2018 the average number of fire-related yearly deaths is 0. The highest number of deaths - 2 took place in 2008, and the lowest - 0 in 2002. The data has a constant trend.
The average number of deaths per 1,000 fire incidents is 2. This indicator was the highest - 13 in 2008, and the lowest 0 in 2002. The trend for deaths per 1,000 fires is increasing. Compared to the Florida value the number of deaths per 1,000 fire incidents is higher.Deaths per 1,000 incidents in Lauderhill, FL compared to nearest cities:
(Note: Based on data for all years, including only cities with at least 2,500 fire incidents)
| Lauderhill: | 2.3 |
| Plantation: | 0.4 |
| Fort Lauderdale: | 0.8 |
| Davie: | 0.8 |
| Coral Springs: | 0.6 |
| Hollywood: | 1.1 |
| Pembroke Pines: | 1.4 |
| Miami Gardens: | 0.0 |
| Miramar: | 1.5 |
 Based on the data from the years 2002 - 2018 the average number of fire-related casualties per year is 7. The highest number of injuries - 18 took place in 2017, and the lowest - 0 in 2002. The data has an increasing trend.
The average number of injuries per 1,000 fire incidents is 39. This indicator was the highest - 84 in 2011, and the lowest 0 in 2002. The trend for casualties per 1,000 incidents is growing. Compared to the Florida value the number of injuries per 1,000 incidents is much higher.
Based on the data from the years 2002 - 2018 the average number of fire-related casualties per year is 7. The highest number of injuries - 18 took place in 2017, and the lowest - 0 in 2002. The data has an increasing trend.
The average number of injuries per 1,000 fire incidents is 39. This indicator was the highest - 84 in 2011, and the lowest 0 in 2002. The trend for casualties per 1,000 incidents is growing. Compared to the Florida value the number of injuries per 1,000 incidents is much higher.Casualties per 1,000 incidents in Lauderhill, FL compared to nearest cities:
(Note: Based on data for all years, including only cities with at least 500 fire incidents)
| Lauderhill: | 39.2 |
| Lauderdale Lakes: | 31.3 |
| Tamarac: | 7.1 |
| Plantation: | 6.6 |
| Sunrise: | 32.6 |
| North Lauderdale: | 7.7 |
| Oakland Park: | 0.5 |
| Margate: | 25.8 |
| Fort Lauderdale: | 9.8 |
 31.2% incidents where reported in the morning and 68.8% in the evening. The most fires (15.6%) took place on Sunday, and the least (12.8%) on Thursday.
 According to the 3,065 fires from years 2002 - 2018 most fires (10.1%) took place during March, and the least (6.3%) in September.
 Out of all 72,049 cases reported during the years 2002 - 2018, the most belonged to the categories: Rescue & EMS (66.5%), Good Intent Call (14.8%), and False Alarm (5.7%).
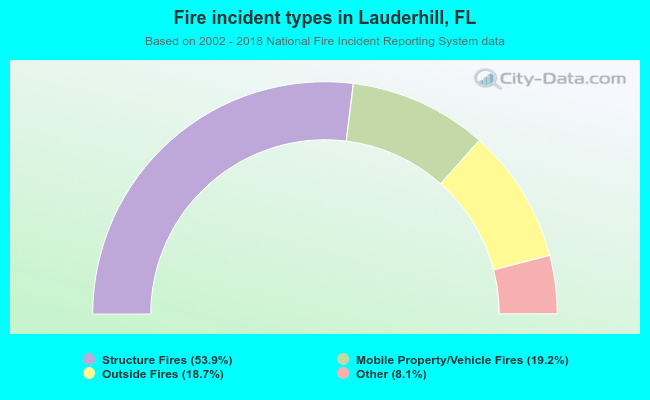 When looking into fire subcategories, the most incidents belonged to: Structure Fires (53.9%), and Mobile Property/Vehicle Fires (19.2%).