Niceville: Fire Incidents, Florida (FL)
Where are fire incidents reported in Niceville, FL
Something went wrong! Please refresh the page.
| Fire incidents reported | |
|---|---|
| Sreet name | Count |
| JOHN SIMS PKY | 164 |
| BAYSHORE DR | 92 |
| PARTIN DR | 76 |
| REEVES ST | 68 |
| SR85 HWY | 58 |
| KELLY RD | 56 |
| COLLEGE BLVD | 40 |
| 23RD ST | 36 |
| HIGHWAY 20 | 36 |
| VALPARAISO BLVD | 32 |
| PALM BLVD | 30 |
| EAST HIGHWAY 20 | 26 |
| REDWOOD AVE | 24 |
| SR285 HWY | 24 |
| FIR AVE | 22 |
| JOHN SIMS PKWY PKY | 22 |
| 27TH ST | 20 |
| BAY DRIVE | 20 |
| EDGE AVE | 20 |
| HIGHWAY 20 EAST | 20 |
| NICEVILLE AVE | 20 |
| WHITE POINT ROAD | 20 |
| 20 HWY | 18 |
| 22ND ST | 18 |
| HICKORY AVE | 18 |
| 23RD | 16 |
| CORAL DR | 16 |
| GOVERNMENT AVE | 16 |
| HICKORY STREET | 16 |
| HONEYSUCKLE WAY | 16 |
| Other | 866 |
2002 - 2018 National Fire Incident Reporting System (NFIRS) incidents
- Incident types reported to NFIRS in Niceville, FL
- 10,69660.2%Rescue & EMS
- 1,95511.0%Good Intent Call
- 1,92610.8%Fire
- 1,1626.5%Hazardous Condition
- 1,1036.2%Service Call
- 8784.9%False Alarm
- 430.2%Severe Weather
- Fire incident types reported to NFIRS in Niceville, FL
- 1,03753.8%Structure Fires
- 48125.0%Outside Fires
- 28214.6%Mobile Property/Vehicle Fires
- 1266.5%Other
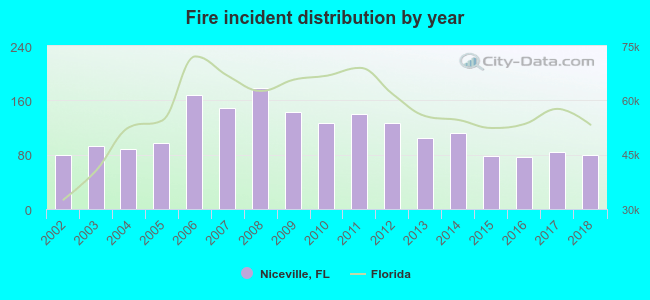 Based on the data from the years 2002 - 2018 the average number of fires per year is 113. The highest number of fires - 178 took place in 2008, and the least - 77 in 2016. The data has a growing trend.
The average number of yearly fire incidents per 10k residents in Niceville, FL compared to nearest cities:
(Note: Based on data for the last 3 years, including only cities with population 5,000 and above)
| Niceville: | 55.8 |
| Valparaiso: | 24.4 |
| Eglin: | 1.6 |
| Destin: | 57.7 |
| Ocean City: | 7.2 |
| Fort Walton Beach: | 85.5 |
| Miramar Beach: | 52.1 |
| Crestview: | 71.6 |
| Navarre: | 34.4 |
 The median response time based on all reported fire incidents is 5 minutes. This is lower compared to the Florida median value.
The median response time in Niceville, FL compared to nearest cities:
(Note: Based on data for all years, including only cities with at least 500 fire incidents)
| Niceville: | 5 minutes |
| Destin: | 6 minutes |
| Fort Walton Beach: | 6 minutes |
| Mary Esther: | 6 minutes |
| Crestview: | 7 minutes |
| Freeport: | 8 minutes |
| Navarre: | 7 minutes |
| Milton: | 8 minutes |
| Westville: | 10 minutes |
 According to the reports from the years 2002 - 2018 the average number of fire-related yearly deaths is 0. The highest number of deaths - 4 took place in 2016, and the lowest - 0 in 2002. The data has a constant trend.
 According to the data from the years 2002 - 2018 the average number of fire-related yearly casualties is 1. The highest number of reported injuries - 5 took place in 2007, and the lowest - 0 in 2002. The data has an increasing trend.
The average number of casualties per 1,000 fires is 12. This indicator was the highest - 35 in 2009, and the lowest 0 in 2002. The trend for injuries per 1,000 incidents is increasing. Compared to the state value the number of injuries per 1,000 incidents is about the same.
According to the data from the years 2002 - 2018 the average number of fire-related yearly casualties is 1. The highest number of reported injuries - 5 took place in 2007, and the lowest - 0 in 2002. The data has an increasing trend.
The average number of casualties per 1,000 fires is 12. This indicator was the highest - 35 in 2009, and the lowest 0 in 2002. The trend for injuries per 1,000 incidents is increasing. Compared to the state value the number of injuries per 1,000 incidents is about the same.Casualties per 1,000 incidents in Niceville, FL compared to nearest cities:
(Note: Based on data for all years, including only cities with at least 500 fire incidents)
| Niceville: | 12.5 |
| Destin: | 5.2 |
| Fort Walton Beach: | 9.1 |
| Mary Esther: | 3.5 |
| Crestview: | 17.8 |
| Freeport: | 3.1 |
| Navarre: | 8.8 |
| Milton: | 5.1 |
| Westville: | 1.7 |
 35.5% incidents where reported in the morning and 64.5% in the evening. The most fires (16.1%) took place on Friday, and the least (13.1%) on Sunday.
 Based on the 1,926 fire incidents from years 2002 - 2018 most fires (10.2%) took place during July, and the least (7.0%) in December.
 Out of all 17,779 cases reported during the years 2002 - 2018, the most belonged to the categories: Rescue & EMS (60.2%), Good Intent Call (11.0%), and Fire (10.8%).
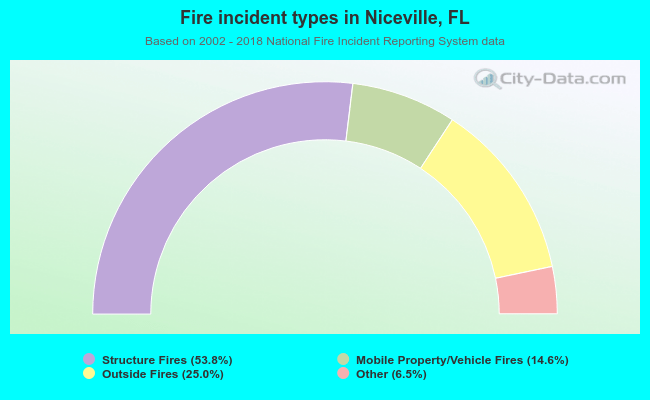 When looking into fire subcategories, the most reports belonged to: Structure Fires (53.8%), and Outside Fires (25.0%).