Milton: Fire Incidents, Florida (FL)
Where are fire incidents reported in Milton, FL
Something went wrong! Please refresh the page.
| Fire incidents reported | |
|---|---|
| Sreet name | Count |
| MUNSON HWY | 132 |
| AVALON BLVD | 106 |
| STEWART ST | 92 |
| CAROLINE ST | 80 |
| HWY 90 | 74 |
| BERRYHILL RD | 70 |
| WILLARD NORRIS RD | 66 |
| GARCON POINT RD | 56 |
| HAMILTON BRIDGE RD | 52 |
| 87 HWY | 50 |
| HWY 90 HWY | 50 |
| JULIA DR | 50 |
| DOGWOOD DR | 48 |
| GARCON POINT RD | 46 |
| HIGHWAY 90 | 44 |
| WARD BASIN RD | 40 |
| AIRPORT RD | 38 |
| HUNTER ST | 38 |
| NICHOLS LAKE RD | 36 |
| 90 HWY | 34 |
| JOHN HAMM RD | 34 |
| BUTTERNUT DR | 32 |
| CARROLL RD | 32 |
| MARTIN RD | 32 |
| PINE BLOSSOM RD | 32 |
| RIDGEWAY BLVD | 32 |
| BELLEVILLE CT | 30 |
| PARK AVE | 30 |
| PINTO AVE | 28 |
| GLOVER LN | 26 |
| Other | 3,029 |
2003 - 2018 National Fire Incident Reporting System (NFIRS) incidents
- Incident types reported to NFIRS in Milton, FL
- 17,49958.4%Rescue & EMS
- 4,53915.1%Fire
- 2,8289.4%Good Intent Call
- 2,0336.8%Service Call
- 1,7825.9%Hazardous Condition
- 1,1153.7%False Alarm
- 1320.4%Special Incident
- 360.1%Severe Weather
- Fire incident types reported to NFIRS in Milton, FL
- 2,06145.4%Structure Fires
- 1,71437.8%Outside Fires
- 54111.9%Mobile Property/Vehicle Fires
- 2234.9%Other
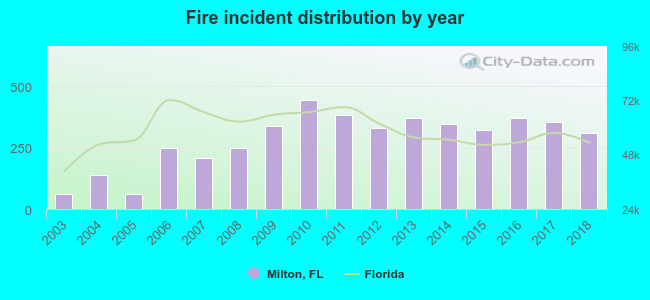 According to the data from the years 2003 - 2018 the average number of fire incidents per year is 283. The highest number of fire incidents - 442 took place in 2010, and the least - 62 in 2003. The data has a growing trend.
The average number of yearly fire incidents per 10k residents in Milton, FL compared to nearest cities:
(Note: Based on data for the last 3 years, including only cities with population 5,000 and above)
| Milton: | 364.9 |
| East Milton: | 21.7 |
| Pace: | 72.2 |
| Cantonment: | 14.9 |
| Brent: | 0.5 |
| Pensacola: | 189.1 |
| West Pensacola: | 0.5 |
| Navarre: | 34.4 |
| Gulf Breeze: | 138.8 |
 The median response time based on all reported fire incidents is 8 minutes. This is higher compared to the Florida median value.
The median response time in Milton, FL compared to nearest cities:
(Note: Based on data for all years, including only cities with at least 500 fire incidents)
| Milton: | 8 minutes |
| Pace: | 8 minutes |
| Cantonment: | 8 minutes |
| Pensacola: | 6 minutes |
| Navarre: | 7 minutes |
| Gulf Breeze: | 7 minutes |
| Mary Esther: | 6 minutes |
| Fort Walton Beach: | 6 minutes |
| Crestview: | 7 minutes |
 According to the reports from the years 2003 - 2018 the average number of fire-related casualties per year is 1. The highest number of injuries - 4 took place in 2011, and the lowest - 0 in 2003. The data has a rising trend.
The average number of injuries per 1,000 fires is 5. This indicator was the highest - 14 in 2004, and the lowest 0 in 2003. The trend for injuries per 1,000 incidents is growing. Compared to the Florida value the number of injuries per 1,000 fires is much lower.
According to the reports from the years 2003 - 2018 the average number of fire-related casualties per year is 1. The highest number of injuries - 4 took place in 2011, and the lowest - 0 in 2003. The data has a rising trend.
The average number of injuries per 1,000 fires is 5. This indicator was the highest - 14 in 2004, and the lowest 0 in 2003. The trend for injuries per 1,000 incidents is growing. Compared to the Florida value the number of injuries per 1,000 fires is much lower.Casualties per 1,000 incidents in Milton, FL compared to nearest cities:
(Note: Based on data for all years, including only cities with at least 500 fire incidents)
| Milton: | 5.1 |
| Pace: | 18.7 |
| Cantonment: | 2.1 |
| Pensacola: | 13.2 |
| Navarre: | 8.8 |
| Gulf Breeze: | 9.2 |
| Mary Esther: | 3.5 |
| Fort Walton Beach: | 9.1 |
| Crestview: | 17.8 |
 28.2% incidents where reported in the morning and 71.8% in the evening. The most fires (15.7%) took place on Saturday, and the least (13.0%) on Tuesday.
 Based on the 4,539 fire incident reports from years 2003 - 2018 most fires (11.1%) took place during March, and the least (6.6%) in September.
 Out of all 29,986 cases reported during the years 2003 - 2018, the most belonged to the categories: Rescue & EMS (58.4%), Fire (15.1%), and Good Intent Call (9.4%).
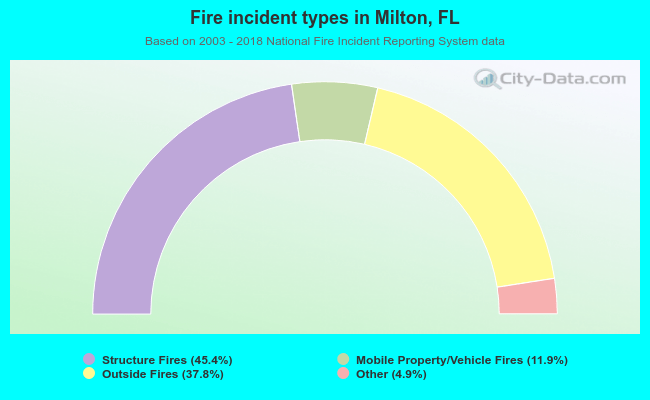 When looking into fire subcategories, the most incidents belonged to: Structure Fires (45.4%), and Outside Fires (37.8%).