Crestview: Fire Incidents, Florida (FL)
Where are fire incidents reported in Crestview, FL
Something went wrong! Please refresh the page.
| Fire incidents reported | |
|---|---|
| Sreet name | Count |
| FERDON BLVD | 158 |
| INTERSTATE 10 | 146 |
| FERDON -S BLVD | 144 |
| JAMES LEE BLVD | 52 |
| FERDON -N BLVD | 42 |
| JOHN KING RD | 38 |
| LAKEVIEW DR | 34 |
| APLIN RD | 32 |
| CHESTNUT AVE | 28 |
| VALLEY RD | 28 |
| JONES RD | 26 |
| ADDISON PL | 24 |
| JAMES LEE -E BLVD | 24 |
| OLD BETHEL RD | 22 |
| PANDORA DR | 22 |
| PINE AVE | 22 |
| REDSTONE -E AVE | 22 |
| ARENA RD | 20 |
| CHESTNUT -E AVE | 20 |
| FIRST AVE | 20 |
| GRAND PRIX DR | 20 |
| JAMES LEE -W BLVD | 20 |
| MARTIN LUTHER KING JR AVE | 20 |
| REDSTONE AVE | 20 |
| ANTIOCH RD | 18 |
| FARMER ST | 18 |
| LAKE SILVER RD | 18 |
| ALABAMA ST | 16 |
| BRACEWELL ST | 16 |
| MAYO TRL | 16 |
| Other | 1,864 |
2005 - 2018 National Fire Incident Reporting System (NFIRS) incidents
- Incident types reported to NFIRS in Crestview, FL
- 15,51761.6%Rescue & EMS
- 2,97011.8%Fire
- 2,70810.8%Hazardous Condition
- 1,6336.5%Service Call
- 1,4675.8%Good Intent Call
- 8243.3%False Alarm
- 300.1%Special Incident
- Fire incident types reported to NFIRS in Crestview, FL
- 1,47549.7%Structure Fires
- 88529.8%Outside Fires
- 40613.7%Mobile Property/Vehicle Fires
- 2046.9%Other
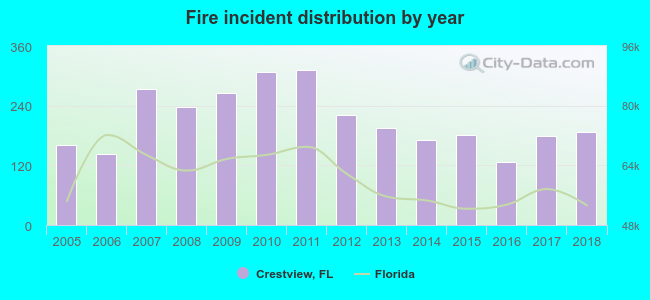 Based on the data from the years 2005 - 2018 the average number of fires per year is 212. The highest number of reported fires - 312 took place in 2011, and the least - 127 in 2016. The data has a growing trend.
The average number of yearly fire incidents per 10k residents in Crestview, FL compared to nearest cities:
(Note: Based on data for the last 3 years, including only cities with population 5,000 and above)
| Crestview: | 71.6 |
| Baker: | 30.8 |
| Niceville: | 55.8 |
| Valparaiso: | 24.4 |
| Eglin: | 1.6 |
| Ocean City: | 7.2 |
| Fort Walton Beach: | 85.5 |
| Destin: | 57.7 |
| East Milton: | 21.7 |
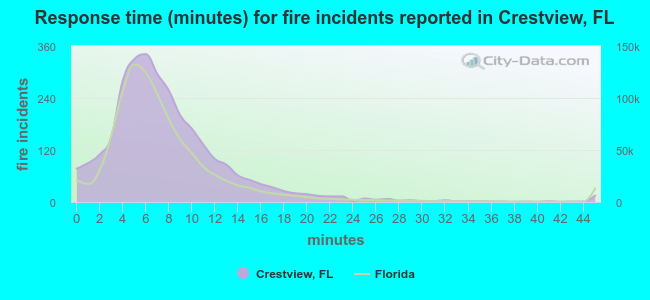 The median response time based on all reported fire incidents is 7 minutes. This is similar to the state median value.
The median response time in Crestview, FL compared to nearest cities:
(Note: Based on data for all years, including only cities with at least 500 fire incidents)
| Crestview: | 7 minutes |
| Niceville: | 5 minutes |
| Fort Walton Beach: | 6 minutes |
| Mary Esther: | 6 minutes |
| Destin: | 6 minutes |
| Milton: | 8 minutes |
| Navarre: | 7 minutes |
| Freeport: | 8 minutes |
| Pace: | 8 minutes |
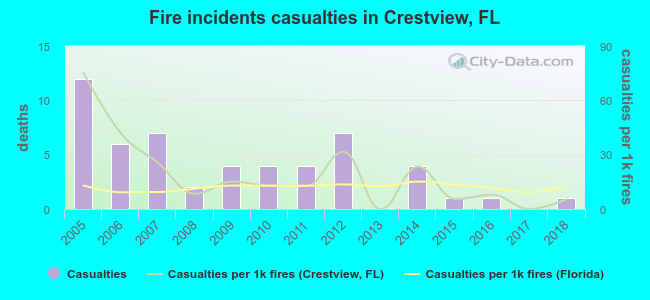 According to the reports from the years 2005 - 2018 the average number of fire-related yearly casualties is 4. The highest number of injuries - 12 took place in 2005, and the lowest - 0 in 2013. The data has a dropping trend.
The average number of casualties per 1,000 fires is 19. This indicator was the highest - 75 in 2005, and the lowest 0 in 2013. The trend for casualties per 1,000 incidents is dropping. Compared to the Florida value the number of injuries per 1,000 fire incidents is higher.
According to the reports from the years 2005 - 2018 the average number of fire-related yearly casualties is 4. The highest number of injuries - 12 took place in 2005, and the lowest - 0 in 2013. The data has a dropping trend.
The average number of casualties per 1,000 fires is 19. This indicator was the highest - 75 in 2005, and the lowest 0 in 2013. The trend for casualties per 1,000 incidents is dropping. Compared to the Florida value the number of injuries per 1,000 fire incidents is higher.Casualties per 1,000 incidents in Crestview, FL compared to nearest cities:
(Note: Based on data for all years, including only cities with at least 500 fire incidents)
| Crestview: | 17.8 |
| Niceville: | 12.5 |
| Fort Walton Beach: | 9.1 |
| Mary Esther: | 3.5 |
| Destin: | 5.2 |
| Milton: | 5.1 |
| Navarre: | 8.8 |
| Freeport: | 3.1 |
| Pace: | 18.7 |
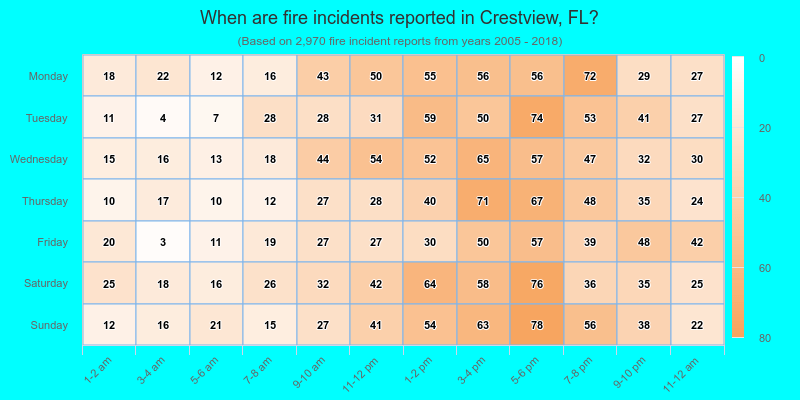
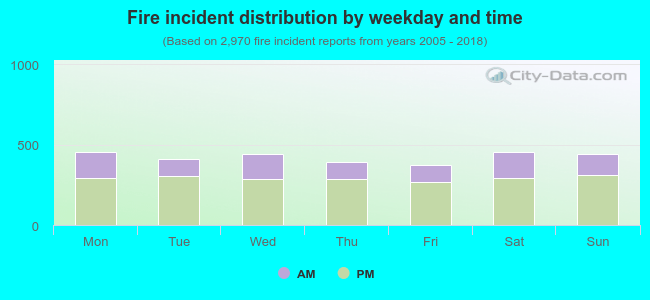 31.4% incidents where reported in the morning and 68.6% in the evening. The most fires (15.4%) took place on Monday, and the least (12.6%) on Friday.
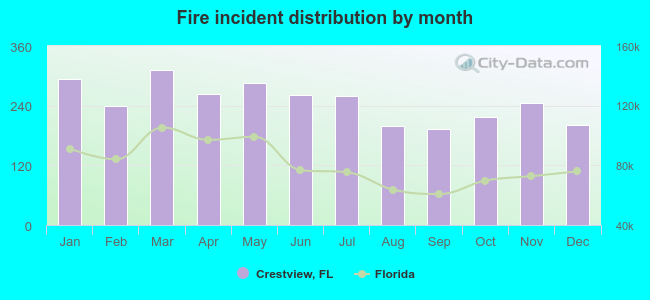 According to the 2,970 reports from years 2005 - 2018 most fires (10.5%) took place during March, and the least (6.5%) in September.
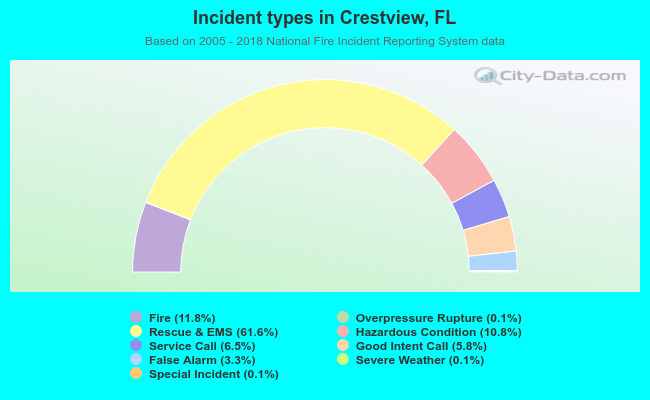 Out of all 25,186 cases reported during the years 2005 - 2018, the most belonged to the categories: Rescue & EMS (61.6%), Fire (11.8%), and Hazardous Condition (10.8%).
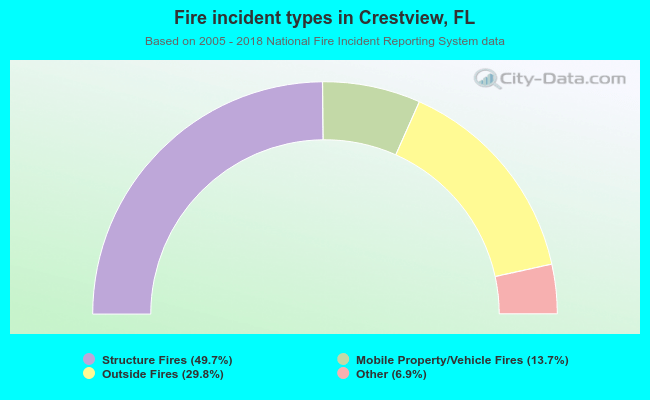 When looking into fire subcategories, the most reports belonged to: Structure Fires (49.7%), and Outside Fires (29.8%).