Miramar Beach: Fire Incidents, Florida (FL)
Where are fire incidents reported in Miramar Beach, FL
Something went wrong! Please refresh the page.
|
| |||||||||||||||||||||||||||||||||||||||||||||||||||||||||||||||||||||||||||||||||||||||||||||||||||||||||||||
2002 - 2018 National Fire Incident Reporting System (NFIRS) incidents
- Incident types reported to NFIRS in Miramar Beach, FL
- 6,96167.6%Rescue & EMS
- 1,04510.1%False Alarm
- 7146.9%Good Intent Call
- 6095.9%Service Call
- 4944.8%Fire
- 4654.5%Hazardous Condition
- Fire incident types reported to NFIRS in Miramar Beach, FL
- 28056.7%Outside Fires
- 14028.3%Structure Fires
- 459.1%Mobile Property/Vehicle Fires
- 295.9%Other
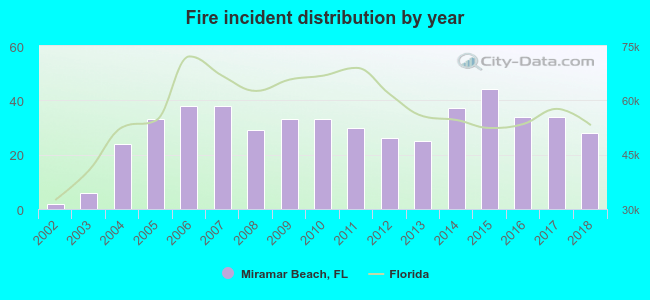 Based on the data from the years 2002 - 2018 the average number of fire incidents per year is 29. The highest number of reported fire incidents - 44 took place in 2015, and the least - 2 in 2002. The data has a growing trend.
The average number of yearly fire incidents per 10k residents in Miramar Beach, FL compared to nearest cities:
(Note: Based on data for the last 3 years, including only cities with population 5,000 and above)
| Miramar Beach: | 52.1 |
| Destin: | 57.7 |
| Niceville: | 55.8 |
| Valparaiso: | 24.4 |
| Eglin: | 1.6 |
| Ocean City: | 7.2 |
| Fort Walton Beach: | 85.5 |
| Crestview: | 71.6 |
| Navarre: | 34.4 |

 31.6% incidents where reported in the morning and 68.4% in the evening. The most fires (17.0%) took place on Monday, and the least (10.9%) on Friday.
 According to the 494 fire incidents from years 2002 - 2018 most fires (16.2%) took place during July, and the least (4.0%) in February.
 Out of all 10,301 cases reported during the years 2002 - 2018, the most belonged to the categories: Rescue & EMS (67.6%), False Alarm (10.1%), and Good Intent Call (6.9%).
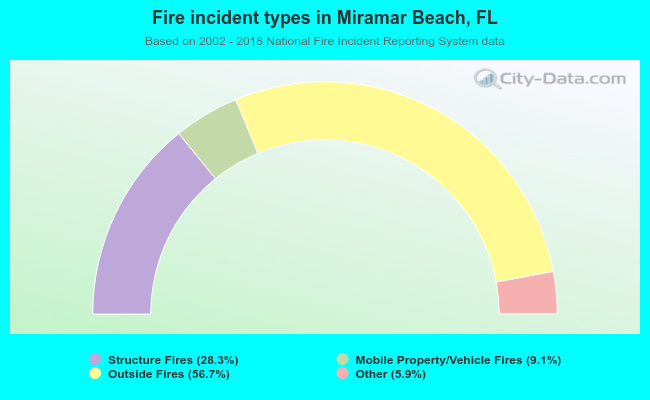 When looking into fire subcategories, the most reports belonged to: Outside Fires (56.7%), and Structure Fires (28.3%).