Longmeadow: Fire Incidents, Massachusetts (MA)
Where are fire incidents reported in Longmeadow, MA
Something went wrong! Please refresh the page.
| Fire incidents reported | |
|---|---|
| Sreet name | Count |
| LONGMEADOW ST | 96 |
| CONVERSE ST | 90 |
| BLISS RD | 58 |
| INTERSTATE 91 | 54 |
| ROUTE 91 | 42 |
| WILLIAMS ST | 32 |
| SHAKER RD | 30 |
| MAPLE RD | 24 |
| TABOR CROSSING RD | 24 |
| PONDSIDE RD | 20 |
| WEST RD | 20 |
| WESTMORELAND AVE | 20 |
| LAUREL ST | 18 |
| KNOLLWOOD DR | 14 |
| PINEWOOD DR | 14 |
| BURBANK RD | 12 |
| CAMBRIDGE CIR | 12 |
| GREENACRE AVE | 12 |
| HOPKINS PL | 12 |
| MEADOW RD | 12 |
| BENEDICT TER | 10 |
| BLUEBERRY HILL RD | 10 |
| BROOKWOOD DR | 10 |
| DWIGHT RD | 10 |
| FIELD RD | 10 |
| MEADOWBROOK RD | 10 |
| NEVINS AVE | 10 |
| WOLF SWAMP RD | 10 |
| ANTHONY RD | 8 |
| BIRNIE RD | 8 |
2002 - 2018 National Fire Incident Reporting System (NFIRS) incidents
- Incident types reported to NFIRS in Longmeadow, MA
- 8,06656.6%Rescue & EMS
- 1,81312.7%False Alarm
- 1,64511.6%Hazardous Condition
- 1,4029.8%Service Call
- 6634.7%Fire
- 6054.2%Good Intent Call
- 170.1%Overpressure Rupture
- 160.1%Severe Weather
- Fire incident types reported to NFIRS in Longmeadow, MA
- 31447.4%Structure Fires
- 19329.1%Outside Fires
- 10415.7%Mobile Property/Vehicle Fires
- 527.8%Other
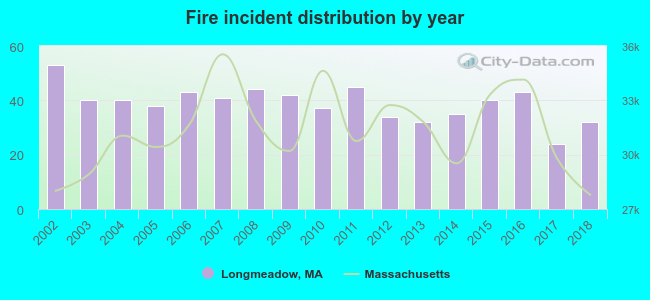 According to the data from the years 2002 - 2018 the average number of fire incidents per year is 39. The highest number of fire incidents - 53 took place in 2002, and the least - 24 in 2017. The data has a decreasing trend.
The average number of yearly fire incidents per 10k residents in Longmeadow, MA compared to nearest cities:
(Note: Based on data for the last 3 years, including only cities with population 5,000 and above)
| Longmeadow: | 20.9 |
| East Longmeadow: | 30.1 |
| Agawam: | 26.7 |
| Springfield: | 37.6 |
| West Springfield: | 30.4 |
| Hampden: | 92.8 |
| Chicopee: | 33.0 |
| Ludlow: | 30.6 |
| Southwick: | 43.9 |
 The median response time based on all reported fire incidents is 6 minutes. This is higher than the Massachusetts median value.
The median response time in Longmeadow, MA compared to nearest cities:
(Note: Based on data for all years, including only cities with at least 500 fire incidents)
| Longmeadow: | 6 minutes |
| East Longmeadow: | 5 minutes |
| Agawam: | 4 minutes |
| Enfield: | 4 minutes |
| Springfield: | 3 minutes |
| West Springfield: | 3 minutes |
| Suffield: | 5 minutes |
| Somers: | 6 minutes |
| Chicopee: | 4 minutes |
 Based on the data from the years 2002 - 2018 the average number of fire-related casualties per year is 0. The highest number of injuries - 4 took place in 2002, and the lowest - 0 in 2003. The data has a declining trend.
The average number of casualties per 1,000 fires is 11. This indicator was the highest - 75 in 2002, and the lowest 0 in 2003. The trend for casualties per 1,000 fire incidents is decreasing. Compared to the Massachusetts value the number of injuries per 1,000 incidents is about the same.
Based on the data from the years 2002 - 2018 the average number of fire-related casualties per year is 0. The highest number of injuries - 4 took place in 2002, and the lowest - 0 in 2003. The data has a declining trend.
The average number of casualties per 1,000 fires is 11. This indicator was the highest - 75 in 2002, and the lowest 0 in 2003. The trend for casualties per 1,000 fire incidents is decreasing. Compared to the Massachusetts value the number of injuries per 1,000 incidents is about the same.Casualties per 1,000 incidents in Longmeadow, MA compared to nearest cities:
(Note: Based on data for all years, including only cities with at least 500 fire incidents)
| Longmeadow: | 12.1 |
| East Longmeadow: | 23.8 |
| Agawam: | 29.0 |
| Enfield: | 14.8 |
| Springfield: | 12.5 |
| West Springfield: | 23.9 |
| Suffield: | 24.7 |
| Somers: | 33.8 |
| Chicopee: | 30.2 |
 29.4% incidents where reported in the morning and 70.6% in the evening. The most fires (17.0%) took place on Sunday, and the least (11.5%) on Saturday.
 According to the 663 fire incidents from years 2002 - 2018 most fires (10.0%) took place during April, and the least (5.7%) in December.
 Out of all 14,239 cases reported during the years 2002 - 2018, the most belonged to the categories: Rescue & EMS (56.6%), False Alarm (12.7%), and Hazardous Condition (11.6%).
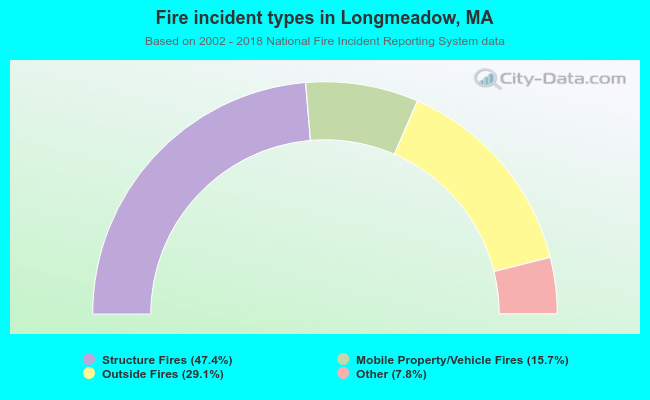 When looking into fire subcategories, the most incidents belonged to: Structure Fires (47.4%), and Outside Fires (29.1%).