Chicopee: Fire Incidents, Massachusetts (MA)
Where are fire incidents reported in Chicopee, MA
Something went wrong! Please refresh the page.
| Fire incidents reported | |
|---|---|
| Sreet name | Count |
| MEMORIAL DR | 626 |
| CHICOPEE ST | 330 |
| FRONT ST | 196 |
| MEADOW ST | 186 |
| SPRINGFIELD ST | 172 |
| BROADWAY | 162 |
| BURNETT RD | 142 |
| CENTER ST | 134 |
| GRATTAN ST | 124 |
| MONTGOMERY ST | 120 |
| EAST MAIN ST | 114 |
| GRANBY RD | 108 |
| MCKINSTRY AVE | 108 |
| EXCHANGE ST | 82 |
| NEW LUDLOW RD | 80 |
| BRITTON ST | 76 |
| NEW LOMBARD RD | 74 |
| EAST ST | 68 |
| MAIN ST | 66 |
| SHERIDAN ST | 66 |
| JOHNSON RD | 64 |
| HAMPDEN ST | 54 |
| PROSPECT ST | 48 |
| INTERSTATE 391 | 46 |
| DEPOT ST | 44 |
| PLANTE CIR | 44 |
| VOLPE DR | 44 |
| GRAPE ST | 40 |
| LITWIN LN | 40 |
| JAMES ST | 36 |
| Other | 512 |
2002 - 2018 National Fire Incident Reporting System (NFIRS) incidents
- Incident types reported to NFIRS in Chicopee, MA
- 13,05143.6%Rescue & EMS
- 4,00613.4%Fire
- 3,83412.8%Service Call
- 3,25210.9%False Alarm
- 2,9369.8%Good Intent Call
- 2,6618.9%Hazardous Condition
- 1500.5%Special Incident
- Fire incident types reported to NFIRS in Chicopee, MA
- 2,00850.1%Structure Fires
- 1,16229.0%Outside Fires
- 57214.3%Mobile Property/Vehicle Fires
- 2646.6%Other
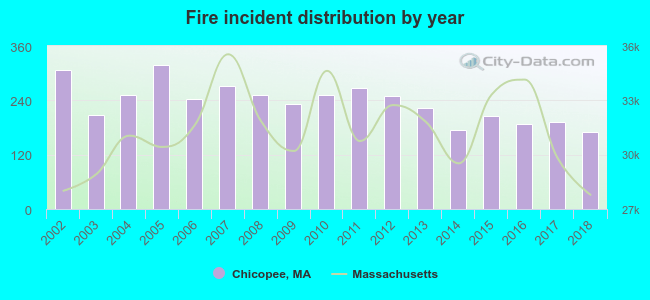 Based on the data from the years 2002 - 2018 the average number of fires per year is 236. The highest number of fire incidents - 319 took place in 2005, and the least - 171 in 2018. The data has a decreasing trend.
The average number of yearly fire incidents per 10k residents in Chicopee, MA compared to nearest cities:
(Note: Based on data for the last 3 years, including only cities with population 5,000 and above)
| Chicopee: | 33.0 |
| Holyoke: | 90.1 |
| South Hadley: | 42.3 |
| Springfield: | 37.6 |
| West Springfield: | 30.4 |
| Ludlow: | 30.6 |
| Agawam: | 26.7 |
| Easthampton: | 27.6 |
| Southampton: | 41.4 |
 The median response time based on all reported fire incidents is 4 minutes. This is comparable to the Massachusetts median value.
The median response time in Chicopee, MA compared to nearest cities:
(Note: Based on data for all years, including only cities with at least 500 fire incidents)
| Chicopee: | 4 minutes |
| Holyoke: | 4 minutes |
| South Hadley: | 4 minutes |
| Springfield: | 3 minutes |
| West Springfield: | 3 minutes |
| Ludlow: | 4 minutes |
| Agawam: | 4 minutes |
| Easthampton: | 6 minutes |
| Wilbraham: | 6 minutes |
 According to the reports from the years 2002 - 2018 the average number of fire-related fatalities per year is 1. The highest number of deaths - 2 took place in 2015, and the lowest - 0 in 2003. The data has an increasing trend.
The average number of deaths per 1,000 fire incidents is 3. This indicator was the highest - 12 in 2018, and the lowest 0 in 2003. The trend for deaths per 1,000 incidents is increasing. Compared to the state value the number of deaths per 1,000 fire incidents is higher.
According to the reports from the years 2002 - 2018 the average number of fire-related fatalities per year is 1. The highest number of deaths - 2 took place in 2015, and the lowest - 0 in 2003. The data has an increasing trend.
The average number of deaths per 1,000 fire incidents is 3. This indicator was the highest - 12 in 2018, and the lowest 0 in 2003. The trend for deaths per 1,000 incidents is increasing. Compared to the state value the number of deaths per 1,000 fire incidents is higher.Deaths per 1,000 incidents in Chicopee, MA compared to nearest cities:
(Note: Based on data for all years, including only cities with at least 2,500 fire incidents)
| Chicopee: | 2.5 |
| Holyoke: | 3.1 |
| Springfield: | 2.4 |
| Enfield: | 2.5 |
 According to the reports from the years 2002 - 2018 the average number of fire-related yearly casualties is 7. The highest number of casualties - 16 took place in 2011, and the lowest - 1 in 2012. The data has a decreasing trend.
The average number of injuries per 1,000 fires is 31. This indicator was the highest - 63 in 2014, and the lowest 4 in 2012. The trend for casualties per 1,000 fires is declining. Compared to the state value the number of casualties per 1,000 fires is much higher.
According to the reports from the years 2002 - 2018 the average number of fire-related yearly casualties is 7. The highest number of casualties - 16 took place in 2011, and the lowest - 1 in 2012. The data has a decreasing trend.
The average number of injuries per 1,000 fires is 31. This indicator was the highest - 63 in 2014, and the lowest 4 in 2012. The trend for casualties per 1,000 fires is declining. Compared to the state value the number of casualties per 1,000 fires is much higher.Casualties per 1,000 incidents in Chicopee, MA compared to nearest cities:
(Note: Based on data for all years, including only cities with at least 500 fire incidents)
| Chicopee: | 30.2 |
| Holyoke: | 8.8 |
| South Hadley: | 11.2 |
| Springfield: | 12.5 |
| West Springfield: | 23.9 |
| Ludlow: | 22.3 |
| Agawam: | 29.0 |
| Easthampton: | 17.3 |
| Wilbraham: | 22.3 |
 29.0% incidents where reported in the morning and 71.0% in the evening. The most fires (15.8%) took place on Saturday, and the least (13.5%) on Monday.
 According to the 4,006 incident reports from years 2002 - 2018 most fires (13.5%) took place during April, and the least (6.1%) in February.
 Out of all 29,923 cases reported during the years 2002 - 2018, the most belonged to the categories: Rescue & EMS (43.6%), Fire (13.4%), and Service Call (12.8%).
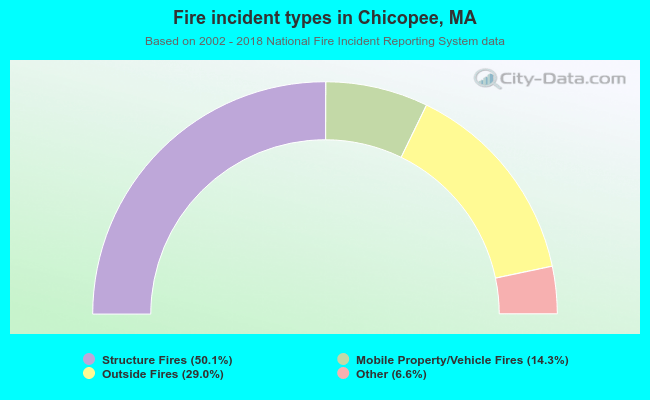 When looking into fire subcategories, the most incidents belonged to: Structure Fires (50.1%), and Outside Fires (29.0%).