Agawam: Fire Incidents, Massachusetts (MA)
Where are fire incidents reported in Agawam, MA
Something went wrong! Please refresh the page.
| Fire incidents reported | |
|---|---|
| Sreet name | Count |
| SPRINGFIELD ST | 196 |
| MAIN ST | 160 |
| SUFFIELD ST | 106 |
| COOPER ST | 86 |
| SHOEMAKER LN | 70 |
| SILVER ST | 66 |
| RIVER RD | 64 |
| NORTH ST | 62 |
| N WESTFIELD ST | 54 |
| S WESTFIELD ST | 50 |
| MILL ST | 48 |
| SOUTHWICK ST | 48 |
| MEADOW ST | 40 |
| S WEST ST | 40 |
| N WEST ST | 30 |
| GARDEN ST | 28 |
| MAPLE ST | 28 |
| PAUL REVERE DR | 28 |
| SOUTH ST | 26 |
| MEADOWBROOK MNR | 24 |
| RED FOX DR | 24 |
| COREY ST | 22 |
| HIGH ST | 22 |
| OAK HILL AVE | 22 |
| PHEASANT HILL DR | 22 |
| ROUTE 57 EAST | 22 |
| MAYNARD ST | 20 |
| JAMES ST | 18 |
| M ST | 18 |
| REGENCY PARK DR | 18 |
2002 - 2018 National Fire Incident Reporting System (NFIRS) incidents
- Incident types reported to NFIRS in Agawam, MA
- 8,31254.8%Rescue & EMS
- 2,10613.9%Service Call
- 1,3809.1%Fire
- 1,2388.2%Hazardous Condition
- 1,2057.9%False Alarm
- 8255.4%Good Intent Call
- 960.6%Special Incident
- Fire incident types reported to NFIRS in Agawam, MA
- 64246.5%Structure Fires
- 46433.6%Outside Fires
- 19314.0%Mobile Property/Vehicle Fires
- 815.9%Other
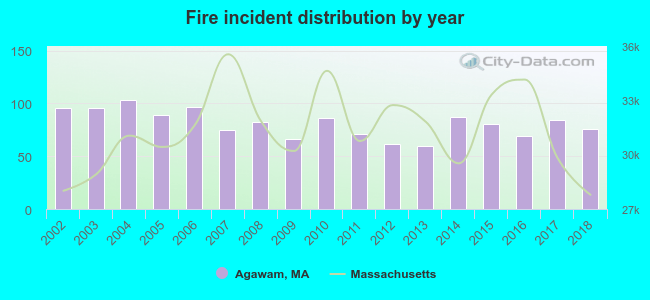 Based on the data from the years 2002 - 2018 the average number of fire incidents per year is 81. The highest number of reported fire incidents - 103 took place in 2004, and the least - 60 in 2013. The data has a declining trend.
The average number of yearly fire incidents per 10k residents in Agawam, MA compared to nearest cities:
(Note: Based on data for the last 3 years, including only cities with population 5,000 and above)
| Agawam: | 26.7 |
| West Springfield: | 30.4 |
| Longmeadow: | 20.9 |
| Springfield: | 37.6 |
| Westfield: | 26.4 |
| Southwick: | 43.9 |
| East Longmeadow: | 30.1 |
| Chicopee: | 33.0 |
| Holyoke: | 90.1 |
 The median response time based on all reported fire incidents is 4 minutes. This is similar to the state median value.
The median response time in Agawam, MA compared to nearest cities:
(Note: Based on data for all years, including only cities with at least 500 fire incidents)
| Agawam: | 4 minutes |
| West Springfield: | 3 minutes |
| Longmeadow: | 6 minutes |
| Springfield: | 3 minutes |
| Suffield: | 5 minutes |
| Westfield: | 5 minutes |
| Southwick: | 9 minutes |
| East Longmeadow: | 5 minutes |
| Enfield: | 4 minutes |
 According to the reports from the years 2002 - 2018 the average number of fire-related yearly casualties is 2. The highest number of reported casualties - 5 took place in 2014, and the lowest - 0 in 2003. The data has a constant trend.
The average number of injuries per 1,000 fires is 28. This indicator was the highest - 62 in 2015, and the lowest 0 in 2003. The trend for injuries per 1,000 fire incidents is growing. Compared to the state value the number of injuries per 1,000 fire incidents is much higher.
According to the reports from the years 2002 - 2018 the average number of fire-related yearly casualties is 2. The highest number of reported casualties - 5 took place in 2014, and the lowest - 0 in 2003. The data has a constant trend.
The average number of injuries per 1,000 fires is 28. This indicator was the highest - 62 in 2015, and the lowest 0 in 2003. The trend for injuries per 1,000 fire incidents is growing. Compared to the state value the number of injuries per 1,000 fire incidents is much higher.Casualties per 1,000 incidents in Agawam, MA compared to nearest cities:
(Note: Based on data for all years, including only cities with at least 500 fire incidents)
| Agawam: | 29.0 |
| West Springfield: | 23.9 |
| Longmeadow: | 12.1 |
| Springfield: | 12.5 |
| Suffield: | 24.7 |
| Westfield: | 16.9 |
| Southwick: | 9.3 |
| East Longmeadow: | 23.8 |
| Enfield: | 14.8 |
 27.8% incidents where reported in the morning and 72.2% in the evening. The most fires (15.6%) took place on Saturday, and the least (11.9%) on Friday.
 According to the 1,380 fire incident reports from years 2002 - 2018 most fires (14.9%) took place during April, and the least (6.1%) in August.
 Out of all 15,180 cases reported during the years 2002 - 2018, the most belonged to the categories: Rescue & EMS (54.8%), Service Call (13.9%), and Fire (9.1%).
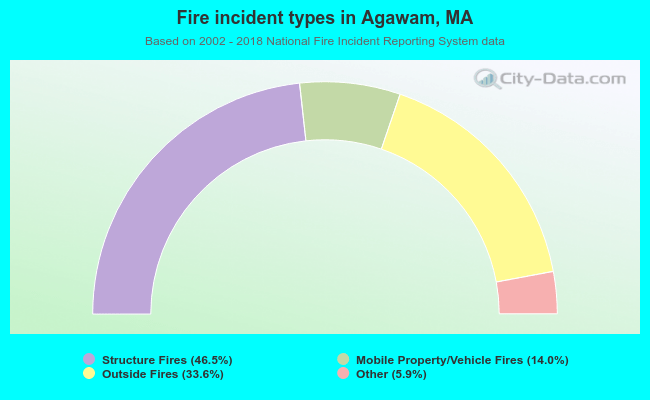 When looking into fire subcategories, the most reports belonged to: Structure Fires (46.5%), and Outside Fires (33.6%).