Easthampton: Fire Incidents, Massachusetts (MA)
Where are fire incidents reported in Easthampton, MA
Something went wrong! Please refresh the page.
| Fire incidents reported | |
|---|---|
| Sreet name | Count |
| MAIN ST | 122 |
| PLEASANT ST | 96 |
| NORTHAMPTON ST | 78 |
| EAST ST | 76 |
| FERRY ST | 58 |
| UNION ST | 56 |
| PARSONS ST | 50 |
| PARK ST | 48 |
| COTTAGE ST | 36 |
| EVERETT ST | 34 |
| LOUDVILLE RD | 32 |
| CLARK ST | 30 |
| HOLYOKE ST | 30 |
| WILLISTON AVE | 30 |
| POMEROY ST | 26 |
| GLENDALE ST | 24 |
| WEST ST | 24 |
| HANNUM BROOK DR | 22 |
| PLAIN ST | 22 |
| CHRISTOPHER CLARK RD | 20 |
| LINE ST | 20 |
| MAPLE ST | 20 |
| STRONG ST | 20 |
| HENDRICK ST | 18 |
| OUT OF TOWN | 18 |
| PAYSON AVE | 18 |
| WARD AVE | 18 |
| BRIGGS ST | 16 |
| LIBERTY ST | 16 |
| SOUTH ST | 16 |
2002 - 2018 National Fire Incident Reporting System (NFIRS) incidents
- Incident types reported to NFIRS in Easthampton, MA
- 12,09070.5%Rescue & EMS
- 1,2297.2%Hazardous Condition
- 1,2017.0%False Alarm
- 9855.7%Fire
- 9855.7%Service Call
- 5393.1%Good Intent Call
- 950.6%Special Incident
- Fire incident types reported to NFIRS in Easthampton, MA
- 54054.8%Structure Fires
- 22823.1%Outside Fires
- 12012.2%Other
- 979.8%Mobile Property/Vehicle Fires
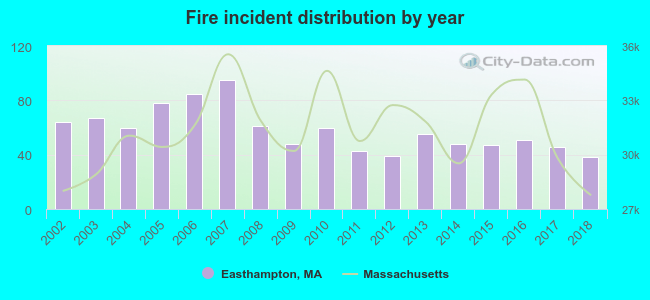 According to the data from the years 2002 - 2018 the average number of fires per year is 58. The highest number of fire incidents - 95 took place in 2007, and the least - 38 in 2018. The data has a dropping trend.
The average number of yearly fire incidents per 10k residents in Easthampton, MA compared to nearest cities:
(Note: Based on data for the last 3 years, including only cities with population 5,000 and above)
| Easthampton: | 27.6 |
| Southampton: | 41.4 |
| Northampton: | 16.5 |
| Holyoke: | 90.1 |
| South Hadley: | 42.3 |
| Chicopee: | 33.0 |
| Hadley: | 23.5 |
| Westfield: | 26.4 |
| West Springfield: | 30.4 |
 The median response time based on all reported fire incidents is 6 minutes. This is higher compared to the state median value.
The median response time in Easthampton, MA compared to nearest cities:
(Note: Based on data for all years, including only cities with at least 500 fire incidents)
| Easthampton: | 6 minutes |
| Northampton: | 6 minutes |
| Holyoke: | 4 minutes |
| South Hadley: | 4 minutes |
| Chicopee: | 4 minutes |
| Westfield: | 5 minutes |
| West Springfield: | 3 minutes |
| Amherst: | 6 minutes |
| Ludlow: | 4 minutes |
 According to the reports from the years 2002 - 2018 the average number of fire-related casualties per year is 1. The highest number of reported injuries - 4 took place in 2005, and the lowest - 0 in 2003. The data has a dropping trend.
The average number of injuries per 1,000 fire incidents is 17. This indicator was the highest - 51 in 2005, and the lowest 0 in 2003. The trend for injuries per 1,000 incidents is declining. Compared to the Massachusetts value the number of injuries per 1,000 incidents is higher.
According to the reports from the years 2002 - 2018 the average number of fire-related casualties per year is 1. The highest number of reported injuries - 4 took place in 2005, and the lowest - 0 in 2003. The data has a dropping trend.
The average number of injuries per 1,000 fire incidents is 17. This indicator was the highest - 51 in 2005, and the lowest 0 in 2003. The trend for injuries per 1,000 incidents is declining. Compared to the Massachusetts value the number of injuries per 1,000 incidents is higher.Casualties per 1,000 incidents in Easthampton, MA compared to nearest cities:
(Note: Based on data for all years, including only cities with at least 500 fire incidents)
| Easthampton: | 17.3 |
| Northampton: | 22.1 |
| Holyoke: | 8.8 |
| South Hadley: | 11.2 |
| Chicopee: | 30.2 |
| Westfield: | 16.9 |
| West Springfield: | 23.9 |
| Amherst: | 27.6 |
| Ludlow: | 22.3 |
 27.9% incidents where reported in the morning and 72.1% in the evening. The most fires (16.4%) took place on Tuesday, and the least (12.6%) on Friday.
 According to the 985 fire incidents from years 2002 - 2018 most fires (12.8%) took place during April, and the least (5.4%) in February.
 Out of all 17,150 cases reported during the years 2002 - 2018, the most belonged to the categories: Rescue & EMS (70.5%), Hazardous Condition (7.2%), and False Alarm (7.0%).
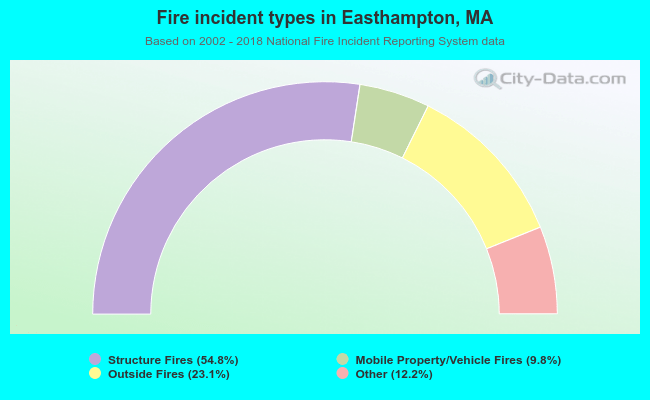 When looking into fire subcategories, the most reports belonged to: Structure Fires (54.8%), and Outside Fires (23.1%).