La Vergne: Fire Incidents, Tennessee (TN)
Where are fire incidents reported in La Vergne, TN
Something went wrong! Please refresh the page.
| Fire incidents reported | |
|---|---|
| Sreet name | Count |
| INTERSTATE 24 | 152 |
| MURFREESBORO RD | 136 |
| WALDRON RD | 64 |
| OLD NASHVILLE HWY | 52 |
| SANDHILL RD | 32 |
| STONES RIVER RD | 28 |
| HOLLANDALE RD | 22 |
| JONES MILL RD | 22 |
| BLAKE MOORE DR | 20 |
| DICK BUCHANAN ST | 20 |
| MADISON SQUARE BLVD | 20 |
| RUTHERFORD POINTE CIR | 20 |
| TOM HAILEY BLVD | 20 |
| JEFFERSON PIKE | 18 |
| CENTER ST | 16 |
| DAVIDS WAY | 16 |
| FERGUS RD | 16 |
| INDUSTRIAL BLVD | 16 |
| MERRITT DR | 16 |
| SANFORD RD | 16 |
| EAST NIR SHREIBMAN BLVD | 14 |
| HOLLAND RIDGE DR | 14 |
| LAKE FOREST DR | 14 |
| MADISON DR | 14 |
| MASON CIR | 14 |
| NEW SANFORD RD | 14 |
| BRIDGESTONE PKY | 12 |
| CENTENNIAL DR | 12 |
| GARY LN | 12 |
| LAVERGNE LN | 12 |
| Other | 97 |
2006 - 2018 National Fire Incident Reporting System (NFIRS) incidents
- Incident types reported to NFIRS in La Vergne, TN
- 95139.5%Fire
- 66427.6%Hazardous Condition
- 36815.3%Rescue & EMS
- 2169.0%Service Call
- 1375.7%Good Intent Call
- 692.9%False Alarm
- Fire incident types reported to NFIRS in La Vergne, TN
- 38240.2%Outside Fires
- 35537.3%Structure Fires
- 18319.2%Mobile Property/Vehicle Fires
- 313.3%Other
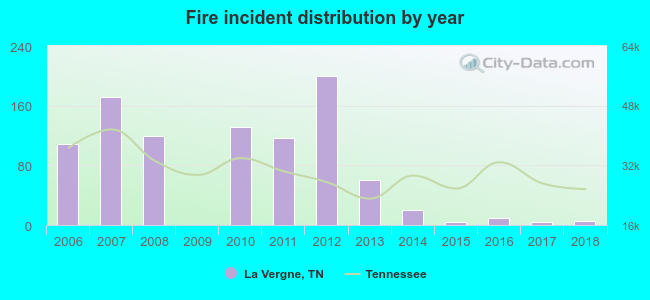 Based on the data from the years 2006 - 2018 the average number of fire incidents per year is 73. The highest number of reported fires - 200 took place in 2012, and the least - 0 in 2009. The data has a dropping trend.
The average number of yearly fire incidents per 10k residents in La Vergne, TN compared to nearest cities:
(Note: Based on data for the last 3 years, including only cities with population 5,000 and above)
| La Vergne: | 1.8 |
| Smyrna: | 37.8 |
| Nolensville: | 35.8 |
| Brentwood: | 22.5 |
| Lascassas: | 23.1 |
| Mount Juliet: | 23.0 |
| Murfreesboro: | 42.6 |
| Franklin: | 30.3 |
| Lebanon: | 91.1 |
 The median response time based on all reported fire incidents is 3 minutes. This is much lower compared to the state median value.
The median response time in La Vergne, TN compared to nearest cities:
(Note: Based on data for all years, including only cities with at least 500 fire incidents)
| La Vergne: | 3 minutes |
| Smyrna: | 6 minutes |
| Brentwood: | 6 minutes |
| Mount Juliet: | 9 minutes |
| Murfreesboro: | 6 minutes |
| Franklin: | 6 minutes |
| Lebanon: | 7 minutes |
| Hendersonville: | 5 minutes |
| Goodlettsville: | 4 minutes |
 29.8% incidents where reported in the morning and 70.2% in the evening. The most fires (16.5%) took place on Saturday, and the least (12.2%) on Tuesday.
 Based on the 951 reports from years 2006 - 2018 most fires (10.9%) took place during July, and the least (6.2%) in February.
 Out of all 2,406 cases reported during the years 2006 - 2018, the most belonged to the categories: Fire (39.5%), Hazardous Condition (27.6%), and Rescue & EMS (15.3%).
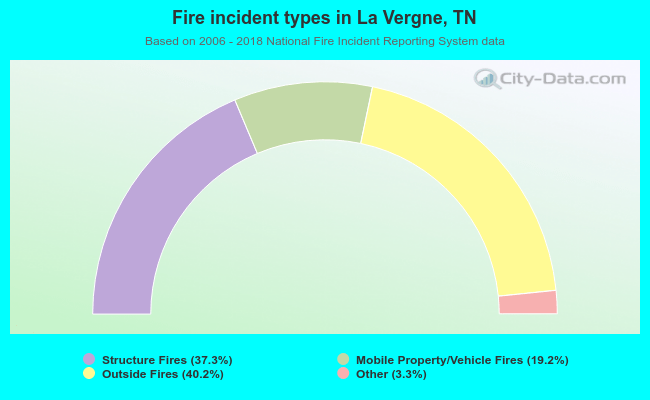 When looking into fire subcategories, the most incidents belonged to: Outside Fires (40.2%), and Structure Fires (37.3%).