Murfreesboro: Fire Incidents, Tennessee (TN)
Where are fire incidents reported in Murfreesboro, TN
Something went wrong! Please refresh the page.
| Fire incidents reported | |
|---|---|
| Sreet name | Count |
| BROAD ST | 456 |
| CHURCH ST | 428 |
| OLD FORT PKY | 418 |
| RUTHERFORD BLVD | 352 |
| NORTHFIELD BLVD | 286 |
| MEMORIAL BLVD | 282 |
| MEDICAL CENTER PKY | 260 |
| MIDDLE TENNESSEE BLVD | 188 |
| MAIN ST | 170 |
| GREENLAND DR | 160 |
| THOMPSON LANE | 142 |
| BRADYVILLE PIKE | 120 |
| TENNESSEE BLVD | 120 |
| LASCASSAS PIKE | 110 |
| WARRIOR DR | 100 |
| FRANKLIN RD | 94 |
| I24 | 78 |
| MERCURY BLVD | 78 |
| FLORENCE RD | 74 |
| NEW SALEM HWY | 74 |
| HAZELWOOD ST | 72 |
| HALLS HILL PIKE | 70 |
| SAINT ANDREWS DR | 70 |
| CASTLE ST | 66 |
| INTERSTATE 24 | 66 |
| JOHN BRAGG HWY | 66 |
| TWIN OAK DR | 64 |
| WENLON DR | 64 |
| MANCHESTER HWY | 62 |
| SULPHUR SPRINGS RD | 60 |
| Other | 3,560 |
2002 - 2018 National Fire Incident Reporting System (NFIRS) incidents
- Incident types reported to NFIRS in Murfreesboro, TN
- 34,46349.3%Rescue & EMS
- 12,21917.5%Good Intent Call
- 8,21011.8%Fire
- 6,9159.9%False Alarm
- 5,3987.7%Hazardous Condition
- 2,5083.6%Service Call
- Fire incident types reported to NFIRS in Murfreesboro, TN
- 3,28740.0%Outside Fires
- 3,25739.7%Structure Fires
- 1,52418.6%Mobile Property/Vehicle Fires
- 1421.7%Other
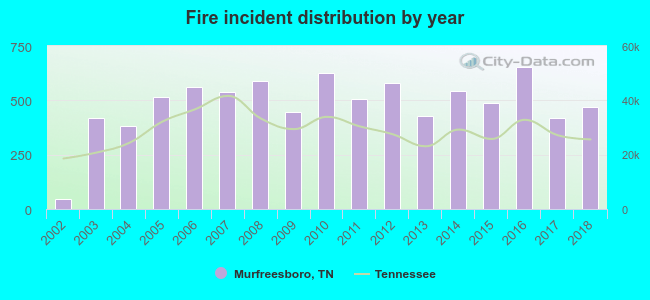 Based on the data from the years 2002 - 2018 the average number of fires per year is 483. The highest number of reported fires - 655 took place in 2016, and the least - 47 in 2002. The data has a growing trend.
The average number of yearly fire incidents per 10k residents in Murfreesboro, TN compared to nearest cities:
(Note: Based on data for the last 3 years, including only cities with population 5,000 and above)
| Murfreesboro: | 42.6 |
| Lascassas: | 23.1 |
| Smyrna: | 37.8 |
| Christiana: | 52.6 |
| La Vergne: | 1.8 |
| Nolensville: | 35.8 |
| Unionville: | 30.1 |
| Brentwood: | 22.5 |
| Lebanon: | 91.1 |
 The median response time based on all reported fire incidents is 6 minutes. This is similar to the state median value.
The median response time in Murfreesboro, TN compared to nearest cities:
(Note: Based on data for all years, including only cities with at least 500 fire incidents)
| Murfreesboro: | 6 minutes |
| Smyrna: | 6 minutes |
| Christiana: | 11 minutes |
| La Vergne: | 3 minutes |
| Woodbury: | 11 minutes |
| Watertown: | 12 minutes |
| Chapel Hill: | 8 minutes |
| Brentwood: | 6 minutes |
| Lebanon: | 7 minutes |
 According to the data from the years 2002 - 2018 the average number of fire-related yearly deaths is 2. The highest number of reported deaths - 4 took place in 2004, and the lowest - 0 in 2002. The data has an increasing trend.
The average number of deaths per 1,000 fires is 4. This indicator was the highest - 10 in 2004, and the lowest 0 in 2002. The trend for fatalities per 1,000 incidents is increasing. Compared to the state value the number of fatalities per 1,000 fires is about the same.
According to the data from the years 2002 - 2018 the average number of fire-related yearly deaths is 2. The highest number of reported deaths - 4 took place in 2004, and the lowest - 0 in 2002. The data has an increasing trend.
The average number of deaths per 1,000 fires is 4. This indicator was the highest - 10 in 2004, and the lowest 0 in 2002. The trend for fatalities per 1,000 incidents is increasing. Compared to the state value the number of fatalities per 1,000 fires is about the same.Deaths per 1,000 incidents in Murfreesboro, TN compared to nearest cities:
(Note: Based on data for all years, including only cities with at least 2,500 fire incidents)
| Murfreesboro: | 3.8 |
| Lebanon: | 2.9 |
| Shelbyville: | 2.0 |
| Franklin: | 2.5 |
| Manchester: | 2.4 |
| Columbia: | 3.1 |
 Based on the data from the years 2002 - 2018 the average number of fire-related yearly casualties is 6. The highest number of reported casualties - 16 took place in 2011, and the lowest - 0 in 2009. The data has a growing trend.
The average number of injuries per 1,000 fire incidents is 12. This indicator was the highest - 32 in 2011, and the lowest 0 in 2009. The trend for casualties per 1,000 fire incidents is decreasing. Compared to the state value the number of injuries per 1,000 incidents is higher.
Based on the data from the years 2002 - 2018 the average number of fire-related yearly casualties is 6. The highest number of reported casualties - 16 took place in 2011, and the lowest - 0 in 2009. The data has a growing trend.
The average number of injuries per 1,000 fire incidents is 12. This indicator was the highest - 32 in 2011, and the lowest 0 in 2009. The trend for casualties per 1,000 fire incidents is decreasing. Compared to the state value the number of injuries per 1,000 incidents is higher.Casualties per 1,000 incidents in Murfreesboro, TN compared to nearest cities:
(Note: Based on data for all years, including only cities with at least 500 fire incidents)
| Murfreesboro: | 12.2 |
| Smyrna: | 48.9 |
| Christiana: | 0.0 |
| La Vergne: | 3.2 |
| Woodbury: | 3.6 |
| Watertown: | 0.0 |
| Chapel Hill: | 1.8 |
| Brentwood: | 8.9 |
| Lebanon: | 4.6 |
 31.1% incidents where reported in the morning and 68.9% in the evening. The most fires (15.3%) took place on Saturday, and the least (13.5%) on Tuesday.
 Based on the 8,210 fire incidents from years 2002 - 2018 most fires (9.1%) took place during June, and the least (7.5%) in September.
 Out of all 69,846 cases reported during the years 2002 - 2018, the most belonged to the categories: Rescue & EMS (49.3%), Good Intent Call (17.5%), and Fire (11.8%).
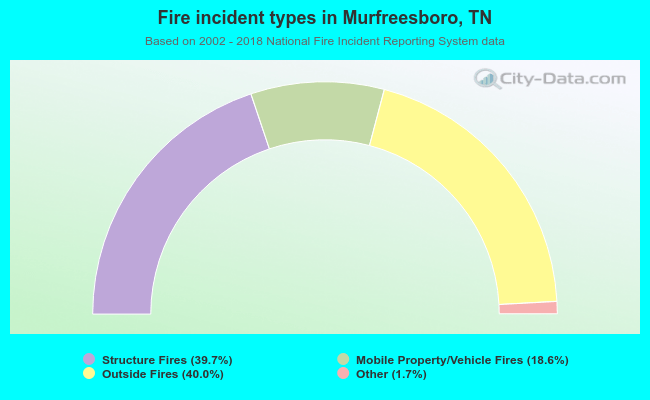 When looking into fire subcategories, the most incidents belonged to: Outside Fires (40.0%), and Structure Fires (39.7%).