Lascassas: Fire Incidents, Tennessee (TN)
Where are fire incidents reported in Lascassas, TN
Something went wrong! Please refresh the page.
|
| |||||||||||||||||||||||||||||||||||||||||||||||||||||||||||||||||||||||||||||||||||||||||||||||||||||||||||||
2003 - 2018 National Fire Incident Reporting System (NFIRS) incidents
- Incident types reported to NFIRS in Lascassas, TN
- 50438.4%Rescue & EMS
- 40030.5%Fire
- 19715.0%Good Intent Call
- 1199.1%Hazardous Condition
- 574.3%False Alarm
- 332.5%Service Call
- Fire incident types reported to NFIRS in Lascassas, TN
- 21854.5%Outside Fires
- 13032.5%Structure Fires
- 4611.5%Mobile Property/Vehicle Fires
- 61.5%Other
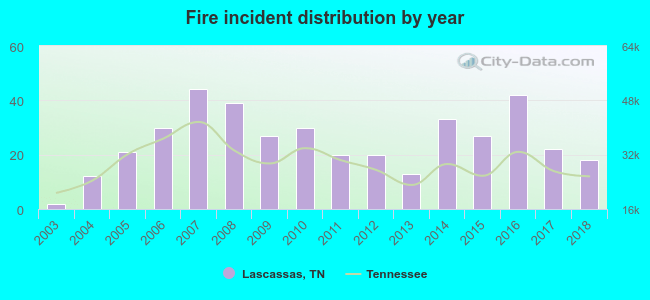 According to the data from the years 2003 - 2018 the average number of fire incidents per year is 25. The highest number of fires - 44 took place in 2007, and the least - 2 in 2003. The data has a rising trend.
The average number of yearly fire incidents per 10k residents in Lascassas, TN compared to nearest cities:
(Note: Based on data for the last 3 years, including only cities with population 5,000 and above)
| Lascassas: | 23.1 |
| Murfreesboro: | 42.6 |
| Smyrna: | 37.8 |
| La Vergne: | 1.8 |
| Lebanon: | 91.1 |
| Nolensville: | 35.8 |
| Mount Juliet: | 23.0 |
| Christiana: | 52.6 |
| Brentwood: | 22.5 |

 29.0% incidents where reported in the morning and 71.0% in the evening. The most fires (18.5%) took place on Monday, and the least (10.8%) on Thursday.
 Based on the 400 reports from years 2003 - 2018 most fires (12.5%) took place during October, and the least (5.3%) in August.
 Out of all 1,311 cases reported during the years 2003 - 2018, the most belonged to the categories: Overpressure Rupture (38.4%), Fire (30.5%), and Service Call (15.0%).
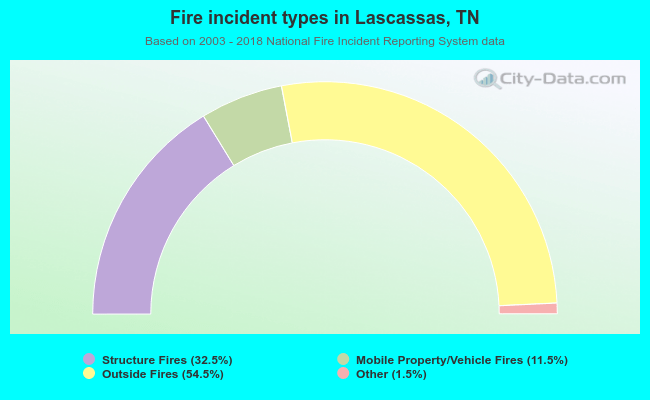 When looking into fire subcategories, the most incidents belonged to: Outside Fires (54.5%), and Structure Fires (32.5%).