Hendersonville: Fire Incidents, Tennessee (TN)
Where are fire incidents reported in Hendersonville, TN
Something went wrong! Please refresh the page.
| Fire incidents reported | |
|---|---|
| Sreet name | Count |
| MAIN ST | 350 |
| NEW SHACKLE ISLAND RD | 132 |
| INDIAN LAKE BLVD | 108 |
| SANDERS FERRY RD | 94 |
| ANDERSON LN | 66 |
| WALTON FERRY RD | 54 |
| INDIAN LAKE RD | 52 |
| LONG HOLLOW PIKE | 50 |
| NEW HOPE RD | 50 |
| FOREST RETREAT RD | 48 |
| WILLIAMSBURG DR | 46 |
| OLD SHACKLE ISLAND RD | 44 |
| HICKORY HEIGHTS DR | 42 |
| CENTER POINT RD | 40 |
| SAUNDERSVILLE RD | 38 |
| GLENBROOK WAY | 32 |
| VIETNAM VETERANS BLVD | 32 |
| DONNA DR | 28 |
| NOKES DR | 28 |
| SR 386 | 28 |
| CHEROKEE RD | 26 |
| EVERGREEN CIR | 26 |
| IRIS DR | 22 |
| LAKE TERRACE DR | 22 |
| ROCKLAND RD | 22 |
| ROBERTA DR | 20 |
| CUMBERLAND HILLS DR | 18 |
| HARBOR DR | 18 |
| HIGHWAY 386 | 18 |
| HILLSDALE DR | 18 |
| Other | 691 |
2002 - 2018 National Fire Incident Reporting System (NFIRS) incidents
- Incident types reported to NFIRS in Hendersonville, TN
- 17,31861.2%Rescue & EMS
- 2,7299.6%Hazardous Condition
- 2,4958.8%Service Call
- 2,2638.0%Fire
- 2,0117.1%False Alarm
- 1,2684.5%Good Intent Call
- 1070.4%Special Incident
- 500.2%Overpressure Rupture
- 420.1%Severe Weather
- Fire incident types reported to NFIRS in Hendersonville, TN
- 1,01945.0%Outside Fires
- 70931.3%Structure Fires
- 39017.2%Mobile Property/Vehicle Fires
- 1456.4%Other
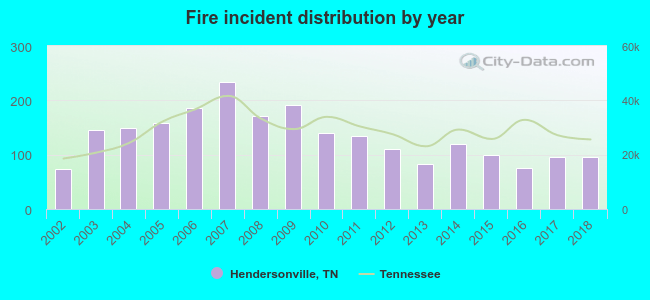 Based on the data from the years 2002 - 2018 the average number of fires per year is 133. The highest number of fire incidents - 233 took place in 2007, and the least - 74 in 2002. The data has an increasing trend.
The average number of yearly fire incidents per 10k residents in Hendersonville, TN compared to nearest cities:
(Note: Based on data for the last 3 years, including only cities with population 5,000 and above)
| Hendersonville: | 16.0 |
| Goodlettsville: | 52.6 |
| Mount Juliet: | 23.0 |
| Millersville: | 28.0 |
| Gallatin: | 36.3 |
| White House: | 48.0 |
| Greenbrier: | 112.2 |
| Castalian Springs: | 25.4 |
| Lebanon: | 91.1 |
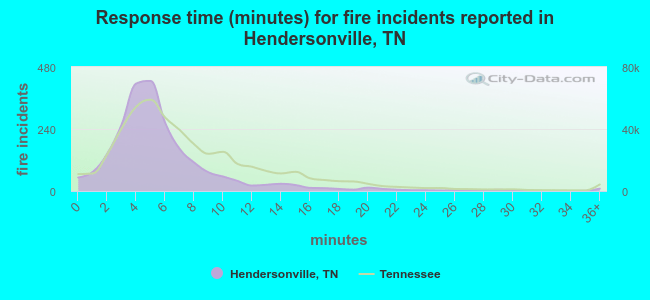 The median response time based on all reported fire incidents is 5 minutes. This is lower than the Tennessee median value.
The median response time in Hendersonville, TN compared to nearest cities:
(Note: Based on data for all years, including only cities with at least 500 fire incidents)
| Hendersonville: | 5 minutes |
| Goodlettsville: | 4 minutes |
| Mount Juliet: | 9 minutes |
| Gallatin: | 5 minutes |
| White House: | 6 minutes |
| Greenbrier: | 8 minutes |
| Lebanon: | 7 minutes |
| La Vergne: | 3 minutes |
| Portland: | 9 minutes |
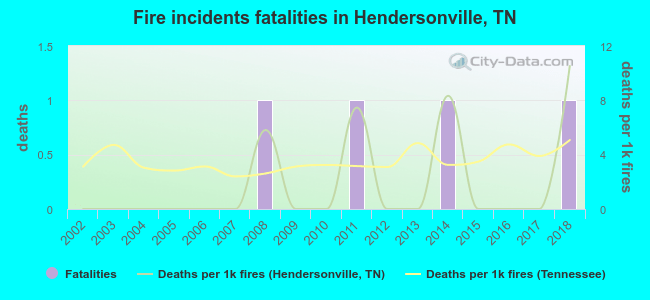 Based on the reports from the years 2002 - 2018 the average number of fire-related fatalities per year is 0. The highest number of reported deaths - 1 took place in 2008, and the lowest - 0 in 2002. The data has a rising trend.
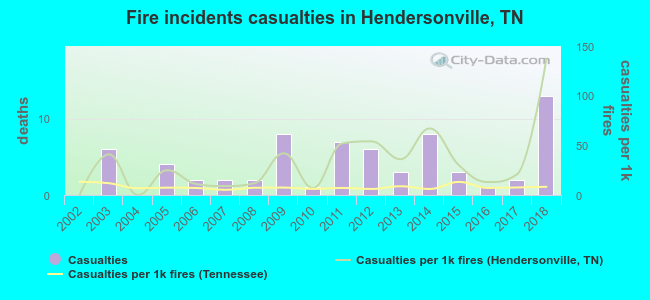 According to the data from the years 2002 - 2018 the average number of fire-related yearly casualties is 4. The highest number of reported injuries - 13 took place in 2018, and the lowest - 0 in 2002. The data has an increasing trend.
The average number of casualties per 1,000 fires is 33. This indicator was the highest - 137 in 2018, and the lowest 0 in 2002. The trend for casualties per 1,000 fire incidents is rising. Compared to the Tennessee value the number of casualties per 1,000 fires is much higher.
According to the data from the years 2002 - 2018 the average number of fire-related yearly casualties is 4. The highest number of reported injuries - 13 took place in 2018, and the lowest - 0 in 2002. The data has an increasing trend.
The average number of casualties per 1,000 fires is 33. This indicator was the highest - 137 in 2018, and the lowest 0 in 2002. The trend for casualties per 1,000 fire incidents is rising. Compared to the Tennessee value the number of casualties per 1,000 fires is much higher.Casualties per 1,000 incidents in Hendersonville, TN compared to nearest cities:
(Note: Based on data for all years, including only cities with at least 500 fire incidents)
| Hendersonville: | 30.0 |
| Goodlettsville: | 7.5 |
| Mount Juliet: | 12.6 |
| Gallatin: | 16.7 |
| White House: | 2.4 |
| Greenbrier: | 9.7 |
| Lebanon: | 4.6 |
| La Vergne: | 3.2 |
| Portland: | 0.6 |
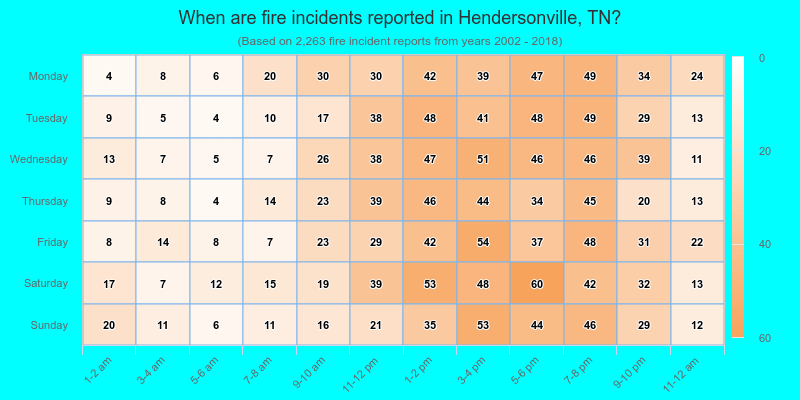
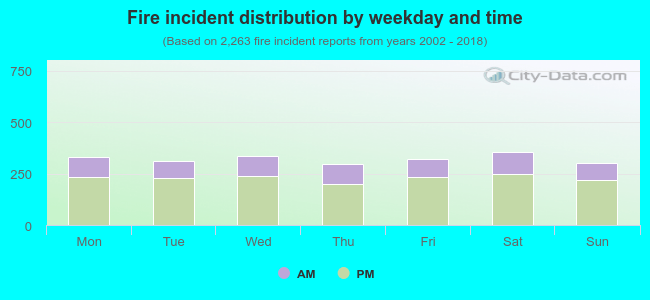 29.0% incidents where reported in the morning and 71.0% in the evening. The most fires (15.8%) took place on Saturday, and the least (13.2%) on Thursday.
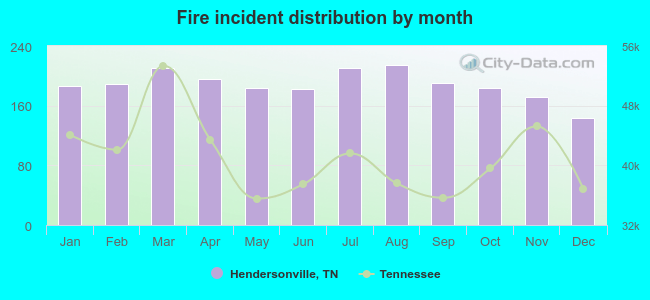 According to the 2,263 reports from years 2002 - 2018 most fires (9.5%) took place during August, and the least (6.3%) in December.
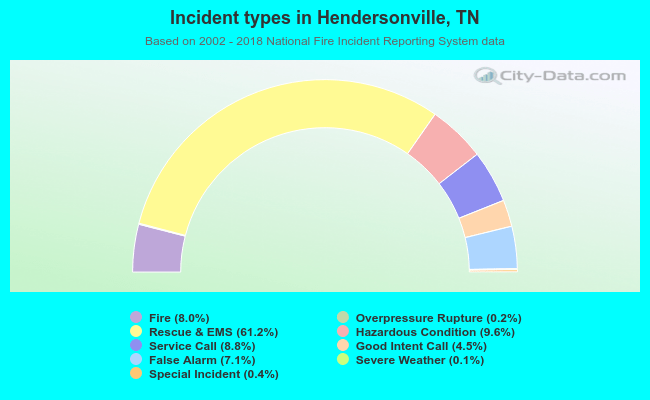 Out of all 28,283 cases reported during the years 2002 - 2018, the most belonged to the categories: Rescue & EMS (61.2%), Hazardous Condition (9.6%), and Service Call (8.8%).
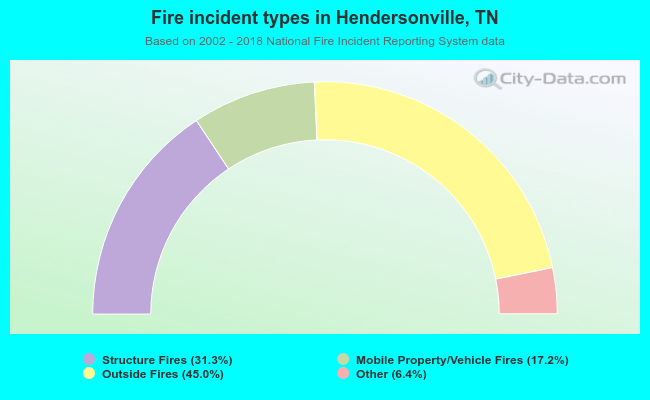 When looking into fire subcategories, the most incidents belonged to: Outside Fires (45.0%), and Structure Fires (31.3%).