Averages for the 2020 tax year for zip code 62018, filed in 2021:
Average Adjusted Gross Income (AGI) in 2020: $37,675 (Individual Income Tax Returns)
Here:
$37,675
State:
$82,626
Salary/wage: $35,180 (reported on 85.6% of returns)
Here:
$35,180
State:
$66,640
(% of AGI for various income ranges: 1162.5% for AGIs below $25k, 3469.2% for AGIs $25k-50k, 6211.9% for AGIs $50k-75k, 8650.0% for AGIs $75k-100k, 14496.7% for AGIs $100k-200k)
Taxable interest for individuals: $357 (reported on 14.4% of returns)
This zip code:
$357
Illinois:
$2,376
(% of AGI for various income ranges: 6.3% for AGIs below $25k, 4.2% for AGIs $25k-50k, 8.8% for AGIs $50k-75k, 3.8% for AGIs $75k-100k, 18.3% for AGIs $100k-200k)
Ordinary dividends: $1,378 (reported on 6.2% of returns)
Here:
$1,378
State:
$9,061
(% of AGI for various income ranges: 4.5% for AGIs below $25k, 12.5% for AGIs $25k-50k, 70.0% for AGIs $75k-100k)
Net capital gain/loss in AGI: +$3,683 (reported on 4.1% of returns)
Here:
+$3,683
State:
+$31,684
(% of AGI for various income ranges: 21.9% for AGIs $25k-50k, 177.5% for AGIs $75k-100k)
Profit/loss from business: +$5,258 (reported on 8.2% of returns)
Here:
+$5,258
State:
+$12,175
(% of AGI for various income ranges: 73.1% for AGIs below $25k, 53.3% for AGIs $25k-50k, 41.2% for AGIs $50k-75k)
Taxable individual retirement arrangement distribution: $9,320 (reported on 3.4% of returns)
62018:
$9,320
Illinois:
$21,613
(% of AGI for various income ranges: 35.9% for AGIs below $25k, 176.9% for AGIs $50k-75k)
Earned income credit: $2,460 (reported on 28.8% of returns)
Here:
$2,460
State:
$2,311
(% of AGI for various income ranges: 133.5% for AGIs below $25k, 97.8% for AGIs $25k-50k)
Percentage of individuals using paid preparers for their 2020 taxes: 97.3%
Here:
97%
State:
93%
(% for various income ranges: 95.3% for AGIs below $25k, 97.7% for AGIs $25k-50k, 100.0% for AGIs $50k-75k, 100.0% for AGIs $75k-100k, 100.0% for AGIs $100k-200k)
Averages for the 2012 tax year for zip code 62018, filed in 2013:
Average Adjusted Gross Income (AGI) in 2012: $33,128 (Individual Income Tax Returns)
Here:
$33,128
State:
$68,058
Salary/wage: $30,867 (reported on 86.3% of returns)
Here:
$30,867
State:
$55,396
(% of AGI for various income ranges: 71.6% for AGIs below $25k, 80.9% for AGIs $25k-50k, 82.5% for AGIs $50k-75k, 87.7% for AGIs $75k-100k, 80.5% for AGIs $100k-200k)
Taxable interest for individuals: $644 (reported on 18.5% of returns)
This zip code:
$644
Illinois:
$1,969
(% of AGI for various income ranges: 0.9% for AGIs below $25k, 0.2% for AGIs $25k-50k, 0.3% for AGIs $50k-75k, 0.2% for AGIs $100k-200k)
Ordinary dividends: $1,100 (reported on 7.5% of returns)
Here:
$1,100
State:
$7,786
(% of AGI for various income ranges: 0.3% for AGIs below $25k, 0.2% for AGIs $25k-50k, 0.7% for AGIs $75k-100k)
Profit/loss from business: +$5,113 (reported on 10.3% of returns)
Here:
+$5,113
State:
+$12,903
(% of AGI for various income ranges: 5.4% for AGIs below $25k, 1.4% for AGIs $25k-50k, 0.3% for AGIs $50k-75k)
Taxable individual retirement arrangement distribution: $6,017 (reported on 4.1% of returns)
62018:
$6,017
Illinois:
$17,929
(% of AGI for various income ranges: 1.1% for AGIs below $25k, 1.8% for AGIs $25k-50k)
Total itemized deductions: $15,021 (22% of AGI, reported on 9.6% of returns)
Here:
$15,021
State:
$26,433
Here:
22.2% of AGI
State:
19.2% of AGI
(% of AGI for various income ranges: 4.5% for AGIs $25k-50k, 5.4% for AGIs $50k-75k, 5.4% for AGIs $75k-100k, 8.5% for AGIs $100k-200k)
Charity contributions: $2,750 (reported on 6.8% of returns)
Here:
$2,750
State:
$4,525
(% of AGI for various income ranges: 0.4% for AGIs $25k-50k, 0.8% for AGIs $50k-75k, 1.5% for AGIs $75k-100k)
Taxes paid: $4,757 (reported on 9.6% of returns)
62018:
$4,757
State:
$11,968
(% of AGI for various income ranges: 1.0% for AGIs $25k-50k, 1.5% for AGIs $50k-75k, 1.9% for AGIs $75k-100k, 3.9% for AGIs $100k-200k)
Earned income credit: $2,370 (reported on 29.5% of returns)
Here:
$2,370
State:
$2,349
(% of AGI for various income ranges: 8.0% for AGIs below $25k, 1.5% for AGIs $25k-50k)
Percentage of individuals using paid preparers for their 2012 taxes: 58.2%
Here:
58%
State:
57%
(% for various income ranges: 53.2% for AGIs below $25k, 60.5% for AGIs $25k-50k, 66.7% for AGIs $50k-75k, 66.7% for AGIs $75k-100k, 75.0% for AGIs $100k-200k)
Averages for the 2004 tax year for zip code 62018, filed in 2005:
Average Adjusted Gross Income (AGI) in 2004: $28,920 (Individual Income Tax Returns)
Here:
$28,920
State:
$54,625
Salary/wage: $27,419 (reported on 87.8% of returns)
Here:
$27,419
State:
$46,811
(% of AGI for various income ranges: 81.2% for AGIs below $10k, 79.3% for AGIs $10k-25k, 85.7% for AGIs $25k-50k, 85.9% for AGIs $50k-75k, 80.6% for AGIs $75k-100k, 73.7% for AGIs over 100k)
Taxable interest for individuals: $759 (reported on 27.5% of returns)
This zip code:
$759
Illinois:
$2,101
(% of AGI for various income ranges: 2.3% for AGIs below $10k, 0.9% for AGIs $10k-25k, 1.0% for AGIs $25k-50k, 0.2% for AGIs $50k-75k, 0.4% for AGIs $75k-100k, 0.2% for AGIs over 100k)
Taxable dividends: $972 (reported on 9.1% of returns)
Here:
$972
State:
$4,306
(% of AGI for various income ranges: 0.4% for AGIs below $10k, 0.2% for AGIs $10k-25k, 0.5% for AGIs $25k-50k, 0.1% for AGIs $50k-75k, 0.3% for AGIs $75k-100k)
Profit/loss from business: +$5,071 (reported on 8.7% of returns)
Here:
+$5,071
State:
+$11,771
(% of AGI for various income ranges: 6.1% for AGIs below $10k, 3.9% for AGIs $10k-25k, 1.1% for AGIs $25k-50k, 0.7% for AGIs $50k-75k)
Total itemized deductions: $12,684 (24% of AGI, reported on 10.9% of returns)
Here:
$12,684
State:
$20,239
Here:
24.3% of AGI
State:
19.5% of AGI
(% of AGI for various income ranges: 2.6% for AGIs $10k-25k, 5.1% for AGIs $25k-50k, 5.4% for AGIs $50k-75k, 5.8% for AGIs $75k-100k, 9.2% for AGIs over 100k)
Charity contributions deductions: $2,322 (4% of AGI, reported on 7.6% of returns)
Here:
$2,322
State:
$3,719
Here:
4.3% of AGI
State:
3.4% of AGI
(% of AGI for various income ranges: 0.3% for AGIs $10k-25k, 0.5% for AGIs $25k-50k, 1.0% for AGIs $50k-75k, 1.1% for AGIs $75k-100k)
Total tax: $3,120 (reported on 68.1% of returns)
62018:
$3,120
State:
$9,882
(% of AGI for various income ranges: 1.7% for AGIs below $10k, 3.4% for AGIs $10k-25k, 6.8% for AGIs $25k-50k, 8.4% for AGIs $50k-75k, 11.9% for AGIs $75k-100k, 14.9% for AGIs over 100k)
Earned income credit: $1,830 (reported on 26.5% of returns)
Here:
$1,830
State:
$1,788
Percentage of individuals using paid preparers for their 2004 taxes: 69.0%
Here:
69%
State:
61%
(% for various income ranges: 62.5% for AGIs below $10k, 67.8% for AGIs $10k-25k, 72.0% for AGIs $25k-50k, 73.4% for AGIs $50k-75k, 79.2% for AGIs $75k-100k, 66.7% for AGIs over 100k)
Household received Food Stamps/SNAP in the past 12 months: 449 Household did not receive Food Stamps/SNAP in the past 12 months: 717
Women who had a birth in the past 12 months: 26 (0 now married, 27 unmarried) Women who did not have a birth in the past 12 months: 554 (215 now married, 338 unmarried)
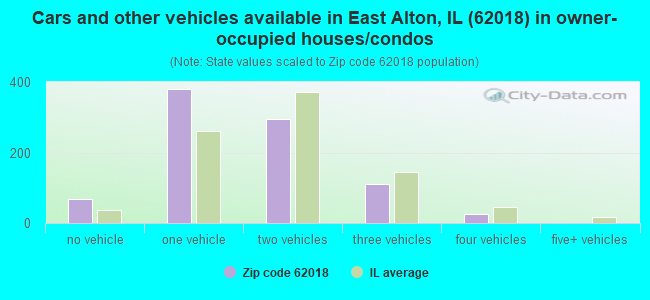
Housing units in zip code 62018 with a mortgage: 439 (63 second mortgage, 36 home equity loan, 26 both second mortgage and home equity loan) Houses without a mortgage: 30
Median monthly owner costs for units with a mortgage: $812 Median monthly owner costs for units without a mortgage: $409
Residents with income below the poverty level in 2022:
This zip code:
28.0%
Whole state:
11.9%
Residents with income below 50% of the poverty level in 2022:
This zip code:
17.2%
Whole state:
5.7%
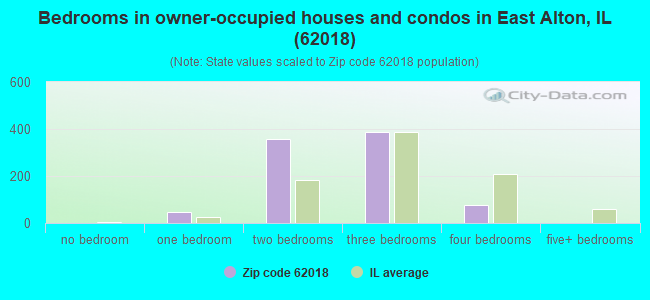
Median number of rooms in houses and condos:
Here:
5.6
State:
6.4
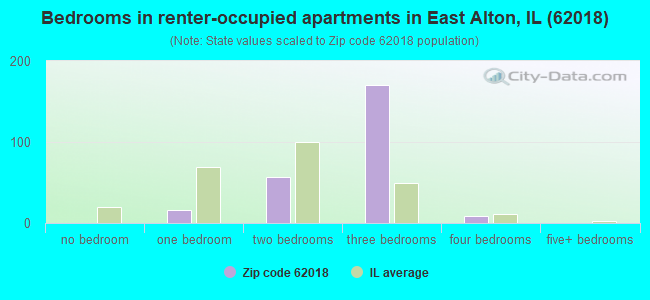
Median number of rooms in apartments:
Here:
5.4
State:
4.1
Notable locations in this zip code not listed on our city pages
In group quarters: 101 (-1 institutionalized population)
Size of family households: 251 2-persons, 278 3-persons, 153 4-persons, 44 5-persons, 17 7-or-more-persons
Size of nonfamily households: 340 1-person, 42 2-persons
293 married couples with children.
356 single-parent households (4 men, 352 women).
98.0% of residents of 62018 zip code speak English at home.
1.0% of residents speak Spanish at home (100% very well).
0.2% of residents speak other Indo-European language at home (100% not well).
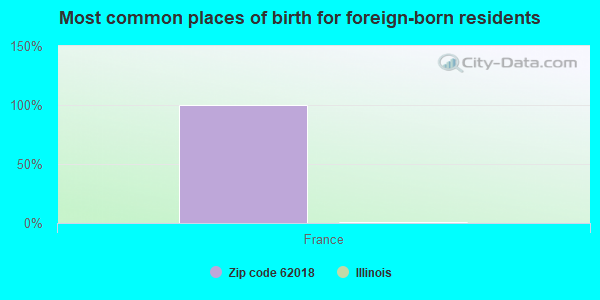
Foreign born population: 6 (0.2%) (0.0% of them are naturalized citizens)
:
0.2%
Whole state:
14.4%
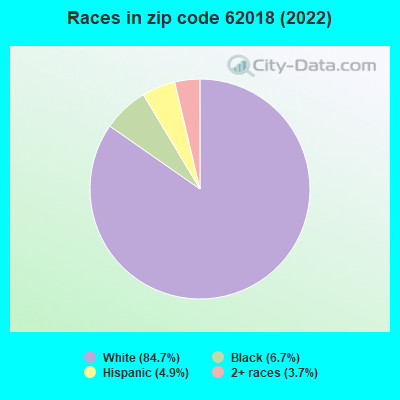
100%France
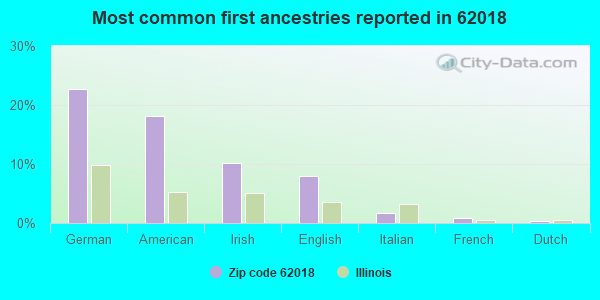
23%German
18%American
10%Irish
8%English
2%Italian
1%French
0%Dutch
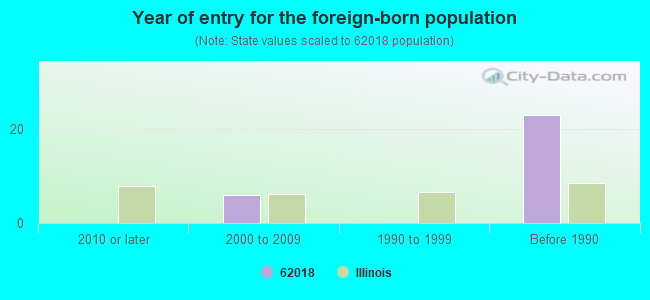
Year of entry for the foreign-born population
02010 or later
62000 to 2009
01990 to 1999
23Before 1990
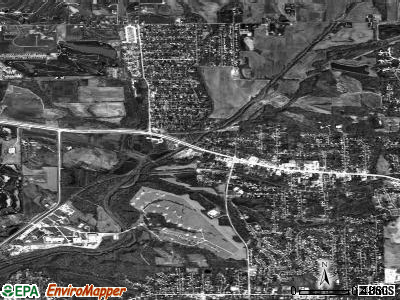
Facilities with environmental interests located in this zip code:
COTTAGE HILLS CLEANERS (33 W MACARTHUR in COTTAGE HILLS, IL)
STATE MASTER (Illinois EPA Project) - AIR PROGRAM AIR MINOR (AIRS/AFS) Business SIC classification: DRYCLEANING PLANTS, EXCEPT RUG CLEANING
CLARK OIL 1554 (220 W MCARTHUR DR in COTTAGE HILLS, IL)
STATE MASTER (Illinois EPA Project) - HAZARDOUS WASTE PROGRAM Small Quantity Generators, between 100 kg and 1000 kg of hazardous waste/month (Resource Conservation and Recovery Act (tracking hazardous waste)) - notification Organizations: CLARK REFINING AND MARKETING (CONTACT/OWNER)
Alternative names: CLARK OIL STATION 1554
COTTAGE HILLS AUTO PARTS (325 W. MACARTHUR in COTTAGE HILLS, IL)
National Pollutant Discharge Elimination System NON-MAJOR (Tracking pollutant discharge elimination systems) - permit Organizations: HEIGERMANN?THOMAS EDWARD (CONTACT/OWNER)
MADISON JERSEY MACOUPIN SP ED JA (1800 STOREY LN in COTTAGE HILLS, IL)
COMPLIANCE ACTIVITY (Tracking inspections of insecticide, fungicide, and rodenticide, and toxic substances)
Housing units lacking complete plumbing facilities: 0.3% Housing units lacking complete kitchen facilities: 0.3%
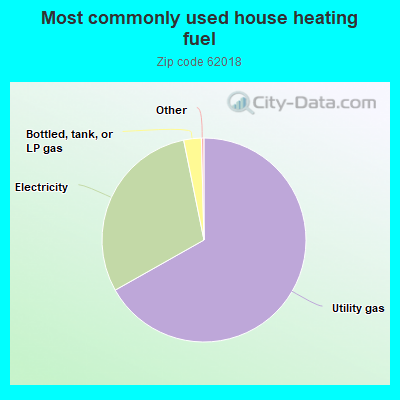
66.9%Utility gas
30.0%Electricity
2.8%Bottled, tank, or LP gas
Population in 1990: 4,437.
Place of birth for U.S.-born residents:
This state: 2,224
Northeast: 50
Midwest: 310
South: 213
West: 71
51% of the 62018 zip code residents lived in the same house 5 years ago. Out of people who lived in different houses, 79% lived in this county. Out of people who lived in different counties, 50% lived in Illinois.
89% of the 62018 zip code residents lived in the same house 1 year ago. Out of people who lived in different houses, 87% moved from this county. Out of people who lived in different houses, 7% moved from different state.
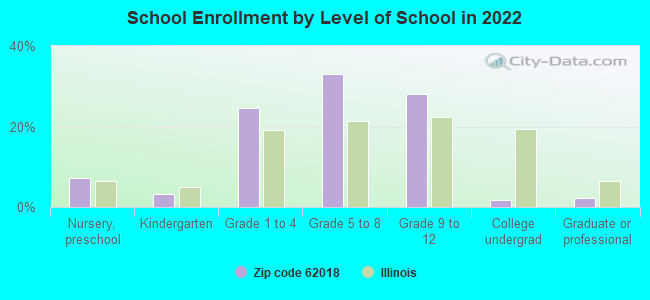
Private vs. public school enrollment:
Students in private schools in grades 1 to 8 (elementary and middle school): 36
Here:
10.2%
Illinois:
13.3%
Students in private schools in grades 9 to 12 (high school):
Here:
0.0%
Illinois:
9.9%
Students in private undergraduate colleges: 4
Here:
46.4%
Illinois:
27.4%
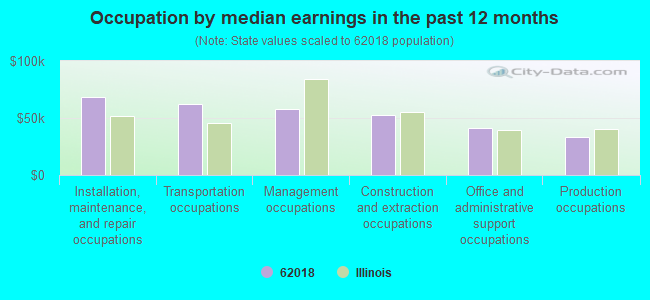
Occupation by median earnings in the past 12 months ($)
68,652Installation, maintenance, and repair occupations
61,880Transportation occupations
58,011Management occupations
52,599Construction and extraction occupations
41,415Office and administrative support occupations
33,207Production occupations
Top industries in this zip code by the number of employees in 2005:
Administrative and Support and Waste Management and Remediation Services: Janitorial Services (20-49 employees: 1 establishment, 1-4 employees: 3 establishments)
Accommodation and Food Services: Full-Service Restaurants (10-19: 2)
Other Services (except Public Administration): General Automotive Repair (5-9: 1, 1-4: 1)
Construction: Plumbing, Heating, and Air-Conditioning Contractors (5-9: 1, 1-4: 1)
Other Services (except Public Administration): Religious Organizations (1-4: 4)
People in group quarters in 2000:
16 people in homes for the mentally ill
Fatal accident statistics in 2013:
Fatal accident count: 2
Vehicles involved in fatal accidents: 3
Fatal accidents caused by drunken drivers: 0
Fatalities: 3
Persons involved in fatal accidents: 4
Pedestrians involved in fatal accidents: 0
Home Mortgage Disclosure Act Aggregated Statistics For Year 2009 (Based on 6 partial tracts)
A) FHA, FSA/RHS & VA Home Purchase Loans
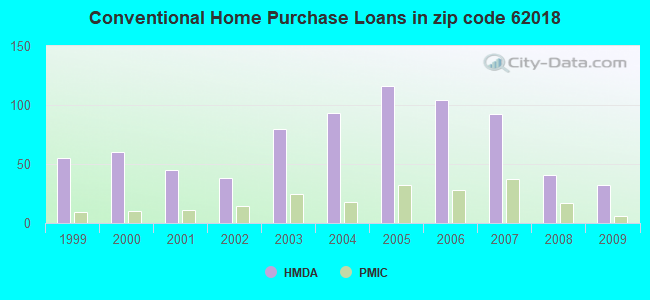
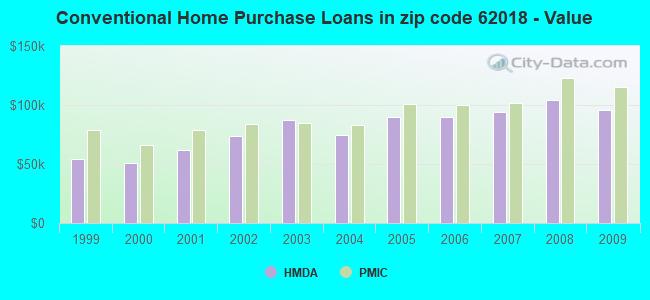
B) Conventional Home Purchase Loans
C) Refinancings
D) Home Improvement Loans
F) Non-occupant Loans on < 5 Family Dwellings (A B C & D)
G) Loans On Manufactured Home Dwelling (A B C & D)
Number
Average Value
Number
Average Value
Number
Average Value
Number
Average Value
Number
Average Value
Number
Average Value
LOANS ORIGINATED
36
$103,000
32
$95,978
174
$112,956
16
$26,105
16
$80,823
2
$26,155
APPLICATIONS APPROVED, NOT ACCEPTED
1
$45,830
2
$82,985
5
$101,894
2
$10,425
0
$0
0
$0
APPLICATIONS DENIED
5
$90,970
7
$51,989
32
$100,429
11
$23,250
0
$0
3
$24,783
APPLICATIONS WITHDRAWN
2
$104,185
2
$80,875
23
$96,265
3
$22,410
2
$75,100
0
$0
FILES CLOSED FOR INCOMPLETENESS
0
$0
0
$0
5
$129,556
2
$19,285
0
$0
1
$2,920
Aggregated Statistics For Year 2008 (Based on 6 partial tracts)
A) FHA, FSA/RHS & VA Home Purchase Loans
B) Conventional Home Purchase Loans
C) Refinancings
D) Home Improvement Loans
E) Loans on Dwellings For 5+ Families
F) Non-occupant Loans on < 5 Family Dwellings (A B C & D)
G) Loans On Manufactured Home Dwelling (A B C & D)
Number
Average Value
Number
Average Value
Number
Average Value
Number
Average Value
Number
Average Value
Number
Average Value
Number
Average Value
LOANS ORIGINATED
25
$106,325
41
$104,389
130
$108,903
12
$28,584
5
$2,118,940
28
$117,328
5
$22,450
APPLICATIONS APPROVED, NOT ACCEPTED
2
$109,620
5
$124,106
14
$97,722
3
$21,447
0
$0
1
$142,120
0
$0
APPLICATIONS DENIED
4
$80,922
7
$71,884
57
$90,618
22
$33,483
0
$0
5
$70,062
6
$26,648
APPLICATIONS WITHDRAWN
2
$157,310
4
$92,492
19
$101,038
3
$57,380
1
$292,870
2
$92,600
0
$0
FILES CLOSED FOR INCOMPLETENESS
1
$68,230
0
$0
3
$96,577
0
$0
0
$0
0
$0
0
$0
Aggregated Statistics For Year 2007 (Based on 6 partial tracts)
A) FHA, FSA/RHS & VA Home Purchase Loans
B) Conventional Home Purchase Loans
C) Refinancings
D) Home Improvement Loans
E) Loans on Dwellings For 5+ Families
F) Non-occupant Loans on < 5 Family Dwellings (A B C & D)
G) Loans On Manufactured Home Dwelling (A B C & D)
Number
Average Value
Number
Average Value
Number
Average Value
Number
Average Value
Number
Average Value
Number
Average Value
Number
Average Value
LOANS ORIGINATED
15
$92,364
92
$94,405
120
$96,149
23
$30,480
4
$1,821,180
25
$86,614
8
$32,546
APPLICATIONS APPROVED, NOT ACCEPTED
0
$0
8
$71,866
19
$93,389
4
$41,175
0
$0
0
$0
2
$49,175
APPLICATIONS DENIED
1
$117,900
25
$83,176
93
$84,806
25
$45,036
0
$0
4
$19,842
7
$39,899
APPLICATIONS WITHDRAWN
3
$62,053
13
$81,004
42
$83,862
5
$52,878
0
$0
3
$59,883
0
$0
FILES CLOSED FOR INCOMPLETENESS
0
$0
2
$72,230
12
$95,486
0
$0
0
$0
0
$0
0
$0
Aggregated Statistics For Year 2006 (Based on 6 partial tracts)
A) FHA, FSA/RHS & VA Home Purchase Loans
B) Conventional Home Purchase Loans
C) Refinancings
D) Home Improvement Loans
E) Loans on Dwellings For 5+ Families
F) Non-occupant Loans on < 5 Family Dwellings (A B C & D)
G) Loans On Manufactured Home Dwelling (A B C & D)
Number
Average Value
Number
Average Value
Number
Average Value
Number
Average Value
Number
Average Value
Number
Average Value
Number
Average Value
LOANS ORIGINATED
9
$90,790
104
$89,807
123
$92,774
22
$40,235
1
$274,850
26
$75,683
7
$55,944
APPLICATIONS APPROVED, NOT ACCEPTED
0
$0
9
$87,846
23
$106,951
4
$48,288
0
$0
1
$94,510
3
$50,197
APPLICATIONS DENIED
4
$105,738
36
$83,836
87
$80,462
27
$54,128
0
$0
3
$57,960
16
$52,261
APPLICATIONS WITHDRAWN
0
$0
8
$116,716
55
$105,806
7
$84,771
0
$0
5
$76,816
1
$77,900
FILES CLOSED FOR INCOMPLETENESS
0
$0
4
$87,880
13
$90,122
0
$0
0
$0
1
$138,510
0
$0
Aggregated Statistics For Year 2005 (Based on 6 partial tracts)
A) FHA, FSA/RHS & VA Home Purchase Loans
B) Conventional Home Purchase Loans
C) Refinancings
D) Home Improvement Loans
E) Loans on Dwellings For 5+ Families
F) Non-occupant Loans on < 5 Family Dwellings (A B C & D)
G) Loans On Manufactured Home Dwelling (A B C & D)
Number
Average Value
Number
Average Value
Number
Average Value
Number
Average Value
Number
Average Value
Number
Average Value
Number
Average Value
LOANS ORIGINATED
22
$98,785
116
$89,878
147
$90,957
25
$44,491
3
$2,266,133
23
$54,830
7
$38,396
APPLICATIONS APPROVED, NOT ACCEPTED
0
$0
13
$73,968
26
$78,420
4
$32,632
0
$0
2
$42,675
4
$47,600
APPLICATIONS DENIED
1
$48,870
51
$45,698
88
$89,252
23
$35,438
0
$0
9
$41,690
23
$29,489
APPLICATIONS WITHDRAWN
0
$0
12
$73,453
67
$102,196
9
$136,257
0
$0
3
$146,143
0
$0
FILES CLOSED FOR INCOMPLETENESS
0
$0
5
$65,956
12
$89,165
1
$77,860
0
$0
1
$71,170
0
$0
Aggregated Statistics For Year 2004 (Based on 6 partial tracts)
A) FHA, FSA/RHS & VA Home Purchase Loans
B) Conventional Home Purchase Loans
C) Refinancings
D) Home Improvement Loans
E) Loans on Dwellings For 5+ Families
F) Non-occupant Loans on < 5 Family Dwellings (A B C & D)
G) Loans On Manufactured Home Dwelling (A B C & D)
Number
Average Value
Number
Average Value
Number
Average Value
Number
Average Value
Number
Average Value
Number
Average Value
Number
Average Value
LOANS ORIGINATED
20
$84,136
93
$74,549
158
$80,030
18
$29,007
2
$2,354,895
24
$54,537
10
$47,723
APPLICATIONS APPROVED, NOT ACCEPTED
1
$59,990
16
$68,481
33
$78,043
1
$89,720
0
$0
1
$61,400
5
$57,184
APPLICATIONS DENIED
4
$111,442
35
$42,680
85
$76,984
19
$16,939
0
$0
5
$48,820
25
$39,652
APPLICATIONS WITHDRAWN
1
$69,400
4
$85,632
64
$90,541
3
$12,673
0
$0
1
$105,570
1
$92,510
FILES CLOSED FOR INCOMPLETENESS
0
$0
2
$45,055
12
$85,998
1
$19,480
0
$0
0
$0
0
$0
Aggregated Statistics For Year 2003 (Based on 6 partial tracts)
A) FHA, FSA/RHS & VA Home Purchase Loans
B) Conventional Home Purchase Loans
C) Refinancings
D) Home Improvement Loans
F) Non-occupant Loans on < 5 Family Dwellings (A B C & D)
Number
Average Value
Number
Average Value
Number
Average Value
Number
Average Value
Number
Average Value
LOANS ORIGINATED
25
$79,157
80
$87,675
345
$80,352
19
$21,877
27
$55,788
APPLICATIONS APPROVED, NOT ACCEPTED
1
$91,340
8
$72,761
45
$80,372
2
$19,995
1
$38,650
APPLICATIONS DENIED
3
$112,813
24
$47,344
106
$76,381
10
$25,626
5
$52,476
APPLICATIONS WITHDRAWN
0
$0
10
$75,583
52
$80,411
1
$3,710
1
$43,690
FILES CLOSED FOR INCOMPLETENESS
1
$84,060
4
$81,992
9
$69,217
0
$0
0
$0
Aggregated Statistics For Year 2002 (Based on 4 partial tracts)
A) FHA, FSA/RHS & VA Home Purchase Loans
B) Conventional Home Purchase Loans
C) Refinancings
D) Home Improvement Loans
F) Non-occupant Loans on < 5 Family Dwellings (A B C & D)
Number
Average Value
Number
Average Value
Number
Average Value
Number
Average Value
Number
Average Value
LOANS ORIGINATED
15
$75,806
38
$73,427
113
$74,623
6
$42,830
8
$51,064
APPLICATIONS APPROVED, NOT ACCEPTED
0
$0
3
$37,077
22
$61,789
4
$24,548
0
$0
APPLICATIONS DENIED
4
$64,270
29
$35,671
57
$64,792
7
$14,087
4
$27,552
APPLICATIONS WITHDRAWN
0
$0
2
$83,770
31
$65,134
2
$13,890
0
$0
FILES CLOSED FOR INCOMPLETENESS
0
$0
1
$66,550
10
$85,055
0
$0
0
$0
Aggregated Statistics For Year 2001 (Based on 4 partial tracts)
A) FHA, FSA/RHS & VA Home Purchase Loans
B) Conventional Home Purchase Loans
C) Refinancings
D) Home Improvement Loans
F) Non-occupant Loans on < 5 Family Dwellings (A B C & D)
Number
Average Value
Number
Average Value
Number
Average Value
Number
Average Value
Number
Average Value
LOANS ORIGINATED
13
$58,326
45
$62,035
98
$70,973
15
$15,084
8
$36,906
APPLICATIONS APPROVED, NOT ACCEPTED
0
$0
5
$56,136
25
$55,425
1
$7,410
1
$39,090
APPLICATIONS DENIED
1
$67,400
23
$47,448
78
$55,564
9
$6,687
2
$62,175
APPLICATIONS WITHDRAWN
0
$0
4
$39,725
23
$62,960
1
$15,500
0
$0
FILES CLOSED FOR INCOMPLETENESS
0
$0
1
$46,320
5
$58,226
0
$0
0
$0
Aggregated Statistics For Year 2000 (Based on 4 partial tracts)
A) FHA, FSA/RHS & VA Home Purchase Loans
B) Conventional Home Purchase Loans
C) Refinancings
D) Home Improvement Loans
F) Non-occupant Loans on < 5 Family Dwellings (A B C & D)
Number
Average Value
Number
Average Value
Number
Average Value
Number
Average Value
Number
Average Value
LOANS ORIGINATED
13
$62,955
60
$50,430
58
$67,540
8
$13,579
10
$51,630
APPLICATIONS APPROVED, NOT ACCEPTED
1
$48,690
10
$39,685
21
$60,847
2
$15,500
2
$24,025
APPLICATIONS DENIED
2
$42,670
44
$37,282
41
$58,583
12
$9,940
3
$22,607
APPLICATIONS WITHDRAWN
0
$0
5
$64,744
19
$51,772
1
$7,750
0
$0
FILES CLOSED FOR INCOMPLETENESS
1
$28,980
0
$0
3
$83,957
0
$0
0
$0
Aggregated Statistics For Year 1999 (Based on 3 partial tracts)
A) FHA, FSA/RHS & VA Home Purchase Loans
B) Conventional Home Purchase Loans
C) Refinancings
D) Home Improvement Loans
F) Non-occupant Loans on < 5 Family Dwellings (A B C & D)
2002 - 2018 National Fire Incident Reporting System (NFIRS) incidents
Based on the data from the years 2002 - 2018 the average number of fires per year is 15. The highest number of reported fire incidents - 39 took place in 2018, and the least - 3 in 2002. The data has an increasing trend.
When looking into fire subcategories, the most incidents belonged to: Structure Fires (52.1%), and Outside Fires (29.7%).
Fire incident types reported to NFIRS in Zip Code 62018
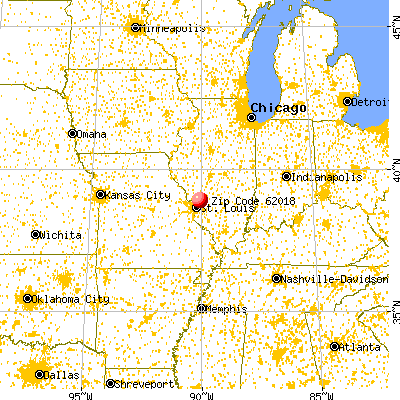


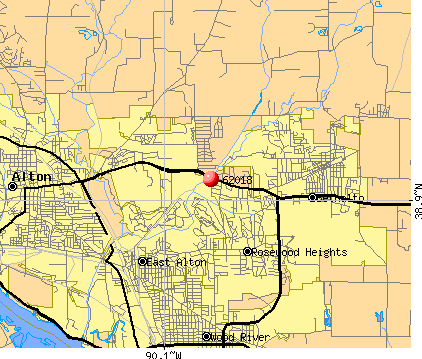 Nearest zip codes: 62024, 62010, 62095, 62002, 62084, 62087.
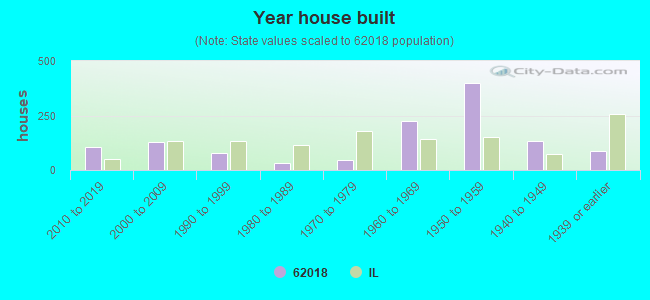


 Based on the data from the years 2002 - 2018 the average number of fires per year is 15. The highest number of reported fire incidents - 39 took place in 2018, and the least - 3 in 2002. The data has an increasing trend.
 When looking into fire subcategories, the most incidents belonged to: Structure Fires (52.1%), and Outside Fires (29.7%).