Estimated zip code population in 2022: 2,091 Zip code population in 2010: 2,087 Zip code population in 2000: 1,889
Houses and condos: 890 Renter-occupied apartments: 235
% of renters here:
30%
State:
33%
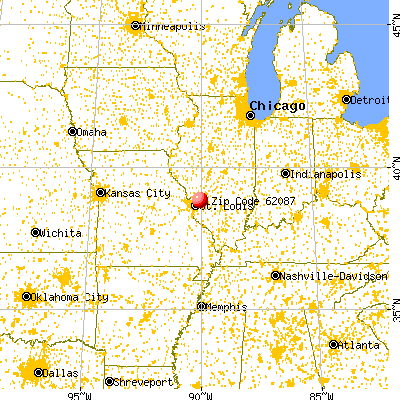
March 2022 cost of living index in zip code 62087: 93.5 (less than average, U.S. average is 100)
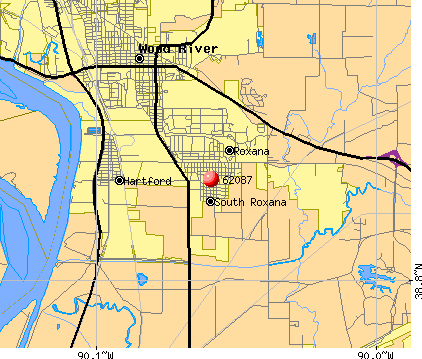
Land area: 3.0 sq. mi. Water area: 0.1 sq. mi.
Population density: 691 people per square mile
(low).
OSM Map
General Map
Google Map
MSN Map
OSM Map
General Map
Google Map
MSN Map
OSM Map
General Map
Google Map
MSN Map
OSM Map
General Map
Google Map
MSN Map
Please wait while loading the map...
Real estate property taxes paid for housing units in 2022:
This zip code:
1.6% ($1,462)
Illinois:
2.0% ($4,912)
Median real estate property taxes paid for housing units with mortgages in 2022: $1,486 (1.5%) Median real estate property taxes paid for housing units with no mortgage in 2022: $1,409 (1.7%)
Business Search- 14 Million verified businesses
Males: 1,031
(49.3%)
Females: 1,060
(50.7%)
For population 25 years and over in 62087:
High school or higher: 87.8%
Bachelor's degree or higher: 4.9%
Graduate or professional degree: 1.1%
Unemployed: 6.6%
Mean travel time to work (commute): 27.6 minutes
For population 15 years and over in 62087:
Never married: 38.1%
Now married: 39.2%
Separated: 2.1%
Widowed: 5.4%
Divorced: 15.2%
Zip code 62087 compared to state average:
Median house value significantly below state average.
Black race population percentage significantly below state average.
Hispanic race population percentage significantly below state average.
Median age below state average.
Foreign-born population percentage significantly below state average.
Length of stay since moving in significantly above state average.
Percentage of population with a bachelor's degree or higher significantly below state average.
Averages for the 2020 tax year for zip code 62087, filed in 2021:
Average Adjusted Gross Income (AGI) in 2020: $37,469 (Individual Income Tax Returns)
Here:
$37,469
State:
$82,626
Salary/wage: $35,639 (reported on 85.7% of returns)
Here:
$35,639
State:
$66,640
(% of AGI for various income ranges: 1196.1% for AGIs below $25k, 3525.7% for AGIs $25k-50k, 6168.0% for AGIs $50k-75k, 7420.0% for AGIs $75k-100k, 14290.0% for AGIs $100k-200k)
Taxable interest for individuals: $300 (reported on 10.7% of returns)
This zip code:
$300
Illinois:
$2,376
(% of AGI for various income ranges: 5.7% for AGIs below $25k, 8.0% for AGIs $50k-75k, 5.0% for AGIs $75k-100k)
Ordinary dividends: $720 (reported on 6.0% of returns)
Here:
$720
State:
$9,061
(% of AGI for various income ranges: 9.6% for AGIs below $25k, 9.0% for AGIs $50k-75k)
Net capital gain/loss in AGI: +$1,475 (reported on 4.8% of returns)
Here:
+$1,475
State:
+$31,684
(% of AGI for various income ranges: 28.1% for AGIs $25k-50k)
Profit/loss from business: +$5,217 (reported on 7.1% of returns)
Here:
+$5,217
State:
+$12,175
(% of AGI for various income ranges: 52.5% for AGIs below $25k, 79.0% for AGIs $25k-50k)
Taxable individual retirement arrangement distribution: $7,125 (reported on 4.8% of returns)
62087:
$7,125
Illinois:
$21,613
(% of AGI for various income ranges: 135.7% for AGIs $25k-50k)
Earned income credit: $2,539 (reported on 27.4% of returns)
Here:
$2,539
State:
$2,311
(% of AGI for various income ranges: 133.6% for AGIs below $25k, 100.0% for AGIs $25k-50k)
Percentage of individuals using paid preparers for their 2020 taxes: 92.9%
Here:
93%
State:
93%
(% for various income ranges: 94.3% for AGIs below $25k, 96.0% for AGIs $25k-50k, 84.6% for AGIs $50k-75k, 85.7% for AGIs $75k-100k, 100.0% for AGIs $100k-200k)
Averages for the 2012 tax year for zip code 62087, filed in 2013:
Average Adjusted Gross Income (AGI) in 2012: $32,715 (Individual Income Tax Returns)
Here:
$32,715
State:
$68,058
Salary/wage: $30,439 (reported on 88.2% of returns)
Here:
$30,439
State:
$55,396
(% of AGI for various income ranges: 72.2% for AGIs below $25k, 83.8% for AGIs $25k-50k, 82.5% for AGIs $50k-75k, 87.2% for AGIs $75k-100k, 87.8% for AGIs $100k-200k)
Taxable interest for individuals: $433 (reported on 14.1% of returns)
This zip code:
$433
Illinois:
$1,969
(% of AGI for various income ranges: 0.2% for AGIs below $25k, 0.4% for AGIs $25k-50k, 0.2% for AGIs $75k-100k)
Ordinary dividends: $720 (reported on 5.9% of returns)
Here:
$720
State:
$7,786
Profit/loss from business: +$4,871 (reported on 8.2% of returns)
Here:
+$4,871
State:
+$12,903
(% of AGI for various income ranges: 6.0% for AGIs below $25k)
Taxable individual retirement arrangement distribution: $8,400 (reported on 4.7% of returns)
62087:
$8,400
Illinois:
$17,929
Total itemized deductions: $16,044 (23% of AGI, reported on 10.6% of returns)
Here:
$16,044
State:
$26,433
Here:
22.6% of AGI
State:
19.2% of AGI
(% of AGI for various income ranges: 6.8% for AGIs $25k-50k, 4.5% for AGIs $50k-75k, 13.4% for AGIs $75k-100k)
Charity contributions: $2,680 (reported on 5.9% of returns)
Here:
$2,680
State:
$4,525
Taxes paid: $5,156 (reported on 10.6% of returns)
62087:
$5,156
State:
$11,968
(% of AGI for various income ranges: 1.5% for AGIs $25k-50k, 1.3% for AGIs $50k-75k, 5.7% for AGIs $75k-100k)
Earned income credit: $2,423 (reported on 30.6% of returns)
Here:
$2,423
State:
$2,349
(% of AGI for various income ranges: 8.7% for AGIs below $25k, 1.7% for AGIs $25k-50k)
Percentage of individuals using paid preparers for their 2012 taxes: 60.0%
Here:
60%
State:
57%
(% for various income ranges: 51.1% for AGIs below $25k, 63.6% for AGIs $25k-50k, 72.7% for AGIs $50k-75k, 120.0% for AGIs $75k-100k)
Averages for the 2004 tax year for zip code 62087, filed in 2005:
Average Adjusted Gross Income (AGI) in 2004: $29,911 (Individual Income Tax Returns)
Here:
$29,911
State:
$54,625
Salary/wage: $27,902 (reported on 90.1% of returns)
Here:
$27,902
State:
$46,811
(% of AGI for various income ranges: 85.7% for AGIs below $10k, 79.4% for AGIs $10k-25k, 84.4% for AGIs $25k-50k, 87.2% for AGIs $50k-75k, 116.2% for AGIs $75k-100k)
Taxable interest for individuals: $415 (reported on 25.4% of returns)
This zip code:
$415
Illinois:
$2,101
(% of AGI for various income ranges: 1.0% for AGIs below $10k, 0.5% for AGIs $10k-25k, 0.5% for AGIs $25k-50k, 0.2% for AGIs $50k-75k, 0.1% for AGIs $75k-100k)
Taxable dividends: $589 (reported on 8.3% of returns)
Here:
$589
State:
$4,306
Net capital gain/loss: +$1,170 (reported on 5.3% of returns)
Here:
+$1,170
State:
+$17,321
Profit/loss from business: +$2,437 (reported on 8.1% of returns)
Here:
+$2,437
State:
+$11,771
(% of AGI for various income ranges: 1.5% for AGIs below $10k, 1.9% for AGIs $10k-25k, 0.7% for AGIs $25k-50k, 0.0% for AGIs $50k-75k)
Total itemized deductions: $12,842 (24% of AGI, reported on 13.6% of returns)
Here:
$12,842
State:
$20,239
Here:
24.2% of AGI
State:
19.5% of AGI
(% of AGI for various income ranges: 3.2% for AGIs $10k-25k, 6.4% for AGIs $25k-50k, 6.1% for AGIs $50k-75k, 12.0% for AGIs $75k-100k)
Charity contributions deductions: $2,270 (4% of AGI, reported on 10.1% of returns)
Here:
$2,270
State:
$3,719
Here:
4.2% of AGI
State:
3.4% of AGI
(% of AGI for various income ranges: 0.4% for AGIs $10k-25k, 0.6% for AGIs $25k-50k, 1.1% for AGIs $50k-75k, 1.5% for AGIs $75k-100k)
Total tax: $3,114 (reported on 67.7% of returns)
62087:
$3,114
State:
$9,882
(% of AGI for various income ranges: 1.2% for AGIs below $10k, 3.2% for AGIs $10k-25k, 6.0% for AGIs $25k-50k, 8.8% for AGIs $50k-75k, 10.3% for AGIs $75k-100k, 15.0% for AGIs over 100k)
Earned income credit: $1,806 (reported on 26.3% of returns)
Here:
$1,806
State:
$1,788
Percentage of individuals using paid preparers for their 2004 taxes: 68.7%
Here:
69%
State:
61%
(% for various income ranges: 54.3% for AGIs below $10k, 67.4% for AGIs $10k-25k, 74.5% for AGIs $25k-50k, 78.1% for AGIs $50k-75k, 100.0% for AGIs $75k-100k)
Household received Food Stamps/SNAP in the past 12 months: 261 Household did not receive Food Stamps/SNAP in the past 12 months: 531
Women who had a birth in the past 12 months: 1 (0 now married, 1 unmarried) Women who did not have a birth in the past 12 months: 546 (153 now married, 394 unmarried)
Housing units in zip code 62087 with a mortgage: 279 (2 second mortgage, 2 both second mortgage and home equity loan) Houses without a mortgage: 37
Median monthly owner costs for units with a mortgage: $908 Median monthly owner costs for units without a mortgage: $586
Residents with income below the poverty level in 2022:
This zip code:
17.0%
Whole state:
11.9%
Residents with income below 50% of the poverty level in 2022:
This zip code:
11.2%
Whole state:
5.7%
Median number of rooms in houses and condos:
Here:
6.0
State:
6.4
Median number of rooms in apartments:
Here:
4.6
State:
4.1
Notable locations in this zip code not listed on our city pages
188 married couples with children.
181 single-parent households (48 men, 133 women).
93.2% of residents of 62087 zip code speak English at home.
5.3% of residents speak Spanish at home (79% very well, 21% well).
0.1% of residents speak other Indo-European language at home (100% not well).
0.3% of residents speak Asian or Pacific Island language at home (100% very well).
Foreign born population: 35 (1.7%) (94.3% of them are naturalized citizens)
This zip code:
1.7%
Whole state:
14.4%
57%Honduras
23%Guatemala
11%Malaysia
6%Serbia
21%English
18%American
10%German
3%Italian
3%Irish
1%Swedish
1%Scottish
Year of entry for the foreign-born population
152010 or later
02000 to 2009
61990 to 1999
26Before 1990
Facilities with environmental interests located in this zip code:
MIKE S INC (109 VELMA AVENUE in SOUTH ROXANA, IL)
STATE MASTER (Illinois EPA Project) - SOLID WASTE PROGRAM, AIR PROGRAM AIR MINOR (AIRS/AFS) CRITERIA AND HAZARDOUS AIR POLLUTANT INVENTORY (Inventory of air pollution sources) National Pollutant Discharge Elimination System NON-MAJOR (Tracking pollutant discharge elimination systems) - permit Business SIC classification: REPAIR SHOPS AND RELATED SERVICES Organizations: MIKE'S INC. (CONTACT/OWNER)
Alternative names: MIKE'S INC.
METRO CONCRETE PRODUCTS INC (WAGON WHEEL RD in SOUTH ROXANA, IL)
STATE MASTER (Illinois EPA Project) - AIR PROGRAM AIR MINOR (AIRS/AFS) CRITERIA AND HAZARDOUS AIR POLLUTANT INVENTORY (Inventory of air pollution sources) Business SIC classification: READY-MIXED CONCRETE
MEYLAN ENTERPRISES CO INC (4206 WAGON WHEEL RD in SOUTH ROXANA, IL)
STATE MASTER (Illinois EPA Project) - SOLID WASTE PROGRAM, HAZARDOUS WASTE PROGRAM Conditionally Exempt Small Quantity Generators, less than 100 kg/month of hazardous waste (Resource Conservation and Recovery Act (tracking hazardous waste)) Organizations: STAHLY CARTAGE CO (CONTACT/OWNER)
Alternative names: STAHLY CARTAGE CO
ODESCO INDUSTRIES (100 WASHINGTON ST in SOUTH ROXANA, IL)
STATE MASTER (Illinois EPA Project) - SOLID WASTE PROGRAM TRANSPORTER (Resource Conservation and Recovery Act (tracking hazardous waste)) Alternative names: DELTA MASTERS AUTO PAINTINGS INC, ODESCO INDUSTRIAL SERVICES INC
GROWMARK INC (HWY 111 SOUTH in SOUTH ROXANA, IL)
Conditionally Exempt Small Quantity Generators, less than 100 kg/month of hazardous waste (Resource Conservation and Recovery Act (tracking hazardous waste))
ILLINOIS PETROLEUM SUPPLY CORP. (ROBIN RD. in SOUTH ROXANA, IL)
AIR MINOR (AIRS/AFS) Business SIC classification: NONCLASSIFIABLE ESTABLISHMENTS
ROXANA STP, VILLAGE OF (WAGON WHEEL ROAD in SOUTH ROXANA, IL)
National Pollutant Discharge Elimination System NON-MAJOR (Tracking pollutant discharge elimination systems) - permit Business SIC classification: SEWERAGE SYSTEMS Alternative names: VILLAGE OF, ROXANA STP
ASBESTOS PROFESSIONAL SERV (PO BOX 364 331 S 5TH ST in SOUTH ROXANA, IL)
COMPLIANCE ACTIVITY (Tracking inspections of insecticide, fungicide, and rodenticide, and toxic substances)
Housing units lacking complete plumbing facilities: 1.6% Housing units lacking complete kitchen facilities: 5.2%
70.4%Utility gas
25.5%Electricity
2.2%Wood
1.2%No fuel used
0.8%Fuel oil, kerosene, etc.
Place of birth for U.S.-born residents:
This state: 1,679
Northeast: 9
Midwest: 205
South: 121
West: 19
62% of the 62087 zip code residents lived in the same house 5 years ago. Out of people who lived in different houses, 70% lived in this county. Out of people who lived in different counties, 50% lived in Illinois.
95% of the 62087 zip code residents lived in the same house 1 year ago. Out of people who lived in different houses, 94% moved from this county.
Private vs. public school enrollment:
Students in private schools in grades 1 to 8 (elementary and middle school): 55
Here:
20.6%
Illinois:
13.3%
Students in private schools in grades 9 to 12 (high school):
Here:
2.2%
Illinois:
9.9%
Students in private undergraduate colleges: 12
Here:
5.7%
Illinois:
27.4%
Occupation by median earnings in the past 12 months ($)
77,916Business and financial operations occupations
59,882Transportation occupations
56,509Construction and extraction occupations
54,869Installation, maintenance, and repair occupations
46,416Production occupations
38,899Architecture and engineering occupations
Companies with federal contracts located in this zip code:
MIKE S INC (109 VELMA AVENUE in SOUTH ROXANA, IL; small business) : $833,991 in 18 contractsfrom 2003 to 2004
Contracts for Miscellaneous Engines and Components, Other Professional Services, Ship and Boat Propulsion Components, Maintenance, Repair and Rebuilding of Equipment -- Ships, Small Craft, Pontoons, and Floating Docks, and moreby U.S. Army Corps of Engineers - civil program financing only, Army Signed by year:2000: $0; 2001: $0; 2002: $0; 2003: $544,591; 2004: $289,400; 2005: $0; 2006: $0.
Biggest contracts:
$171,208 with U.S. Army Corps of Engineers - civil program financing only for Miscellaneous Engines and Components. Signed on 2003-09-30. Completion date: 2003-12-19.
$153,612, same as above.Signed on 2003-06-25. Completion date: 2003-12-19.
$66,000 with Army for Other Professional Services. Taking place in TN. Signed on 2004-01-13. Completion date: 2004-01-30.
$66,000 with U.S. Army Corps of Engineers - civil program financing only for Other Professional Services. Taking place in TN. Signed on 2004-01-13. Completion date: 2004-01-30.
TEAM COOPERHEAT MQS INC (500 BROADWAY AVE in SOUTH ROXANA, IL; small business) : $98,644 in 8 contractsin 2005
Contracts for Lugs, Terminals, and Terminal Strips, Electrical Insulators and Insulating Materials, Metal Heat Treating and Non-Thermal Treating Equipment by Navy, U.S. Army Corps of Engineers - civil program financing only, Army Signed by year:2000: $0; 2001: $0; 2002: $0; 2003: $0; 2004: $0; 2005: $98,644; 2006: $0.
Biggest contracts:
$21,697 with Navy for Lugs, Terminals, and Terminal Strips. Signed on 2005-06-29. Completion date: 2005-07-29.
$20,387 with Navy for Electrical Insulators and Insulating Materials. Signed on 2005-09-10. Completion date: 2005-10-07.
$12,150 with U.S. Army Corps of Engineers - civil program financing only for Metal Heat Treating and Non-Thermal Treating Equipment. Taking place in MO. Signed on 2005-04-15. Completion date: 2005-04-29.
$12,150 with Army for Metal Heat Treating and Non-Thermal Treating Equipment. Taking place in MO. Signed on 2005-04-15. Completion date: 2005-04-29.
INTERSTATE PETROLEUM INC (7346 IL ROUTE 111 in SOUTH ROXANA, IL; small business)
$8,778 with U.S. Army Corps of Engineers - civil program financing only for Oils and Greases: Cutting, Lubricating, and Hydraulic. Taking place in MO. Signed on 2003-06-26. Completion date: 2003-07-02.
Top industries in this zip code by the number of employees in 2005:
Construction: Highway, Street, and Bridge Construction (50-99 employees: 1 establishment, 10-19 employees: 1 establishment)
Other Services (except Public Administration): Religious Organizations (20-49: 1, 5-9: 1, 1-4: 1)
Other Services (except Public Administration): General Automotive Repair (20-49: 1, 1-4: 1)
Construction: Residential Remodelers (20-49: 1)
Professional, Scientific, and Technical Services: Environmental Consulting Services (20-49: 1)
Administrative and Support and Waste Management and Remediation Services: Remediation Services (20-49: 1)
Administrative and Support and Waste Management and Remediation Services: Janitorial Services (10-19: 1, 1-4: 1)
Real Estate and Rental and Leasing: Other Commercial and Industrial Machinery and Equipment Rental and Leasing (5-9: 2)
Fatal accident statistics in 2012:
Fatal accident count: 1
Vehicles involved in fatal accidents: 2
Fatal accidents caused by drunken drivers: 0
Fatalities: 1
Persons involved in fatal accidents: 3
Pedestrians involved in fatal accidents: 0
Home Mortgage Disclosure Act Aggregated Statistics For Year 2009 (Based on 2 partial tracts)
A) FHA, FSA/RHS & VA Home Purchase Loans
B) Conventional Home Purchase Loans
C) Refinancings
D) Home Improvement Loans
F) Non-occupant Loans on < 5 Family Dwellings (A B C & D)
Number
Average Value
Number
Average Value
Number
Average Value
Number
Average Value
Number
Average Value
LOANS ORIGINATED
2
$77,260
2
$55,425
8
$101,744
1
$25,090
1
$62,950
APPLICATIONS APPROVED, NOT ACCEPTED
0
$0
0
$0
1
$53,590
0
$0
0
$0
APPLICATIONS DENIED
0
$0
1
$29,580
3
$84,457
1
$16,940
0
$0
APPLICATIONS WITHDRAWN
0
$0
0
$0
2
$59,755
0
$0
0
$0
FILES CLOSED FOR INCOMPLETENESS
0
$0
0
$0
1
$57,390
0
$0
0
$0
Aggregated Statistics For Year 2008 (Based on 2 partial tracts)
A) FHA, FSA/RHS & VA Home Purchase Loans
B) Conventional Home Purchase Loans
C) Refinancings
D) Home Improvement Loans
F) Non-occupant Loans on < 5 Family Dwellings (A B C & D)
Number
Average Value
Number
Average Value
Number
Average Value
Number
Average Value
Number
Average Value
LOANS ORIGINATED
2
$103,775
3
$67,667
9
$94,610
2
$37,255
2
$88,070
APPLICATIONS APPROVED, NOT ACCEPTED
0
$0
0
$0
1
$100,990
0
$0
0
$0
APPLICATIONS DENIED
1
$59,790
1
$42,660
5
$97,012
2
$40,985
0
$0
APPLICATIONS WITHDRAWN
0
$0
1
$43,990
3
$80,560
0
$0
0
$0
FILES CLOSED FOR INCOMPLETENESS
0
$0
0
$0
1
$62,000
0
$0
0
$0
Aggregated Statistics For Year 2007 (Based on 2 partial tracts)
A) FHA, FSA/RHS & VA Home Purchase Loans
B) Conventional Home Purchase Loans
C) Refinancings
D) Home Improvement Loans
F) Non-occupant Loans on < 5 Family Dwellings (A B C & D)
Number
Average Value
Number
Average Value
Number
Average Value
Number
Average Value
Number
Average Value
LOANS ORIGINATED
1
$128,990
6
$75,987
9
$82,736
3
$45,650
2
$61,050
APPLICATIONS APPROVED, NOT ACCEPTED
0
$0
1
$56,880
2
$88,130
1
$24,460
0
$0
APPLICATIONS DENIED
0
$0
2
$54,860
9
$88,641
2
$51,950
1
$68,640
APPLICATIONS WITHDRAWN
0
$0
1
$29,140
3
$103,880
1
$45,310
0
$0
FILES CLOSED FOR INCOMPLETENESS
0
$0
0
$0
1
$125,140
0
$0
0
$0
Aggregated Statistics For Year 2006 (Based on 2 partial tracts)
A) FHA, FSA/RHS & VA Home Purchase Loans
B) Conventional Home Purchase Loans
C) Refinancings
D) Home Improvement Loans
F) Non-occupant Loans on < 5 Family Dwellings (A B C & D)
G) Loans On Manufactured Home Dwelling (A B C & D)
Number
Average Value
Number
Average Value
Number
Average Value
Number
Average Value
Number
Average Value
Number
Average Value
LOANS ORIGINATED
1
$106,370
7
$84,110
11
$83,062
3
$30,757
2
$91,070
0
$0
APPLICATIONS APPROVED, NOT ACCEPTED
0
$0
1
$64,970
2
$94,925
0
$0
0
$0
0
$0
APPLICATIONS DENIED
0
$0
3
$69,140
9
$86,760
2
$59,060
1
$24,080
1
$51,130
APPLICATIONS WITHDRAWN
0
$0
1
$105,480
6
$88,943
1
$43,670
0
$0
0
$0
FILES CLOSED FOR INCOMPLETENESS
0
$0
0
$0
1
$121,220
0
$0
0
$0
0
$0
Aggregated Statistics For Year 2005 (Based on 2 partial tracts)
A) FHA, FSA/RHS & VA Home Purchase Loans
B) Conventional Home Purchase Loans
C) Refinancings
D) Home Improvement Loans
F) Non-occupant Loans on < 5 Family Dwellings (A B C & D)
G) Loans On Manufactured Home Dwelling (A B C & D)
Number
Average Value
Number
Average Value
Number
Average Value
Number
Average Value
Number
Average Value
Number
Average Value
LOANS ORIGINATED
1
$119,380
7
$75,361
13
$73,545
3
$29,810
1
$79,440
0
$0
APPLICATIONS APPROVED, NOT ACCEPTED
0
$0
0
$0
2
$85,920
0
$0
0
$0
0
$0
APPLICATIONS DENIED
0
$0
3
$60,610
11
$83,671
3
$23,953
0
$0
2
$44,745
APPLICATIONS WITHDRAWN
0
$0
1
$125,330
7
$104,289
1
$132,530
0
$0
0
$0
FILES CLOSED FOR INCOMPLETENESS
0
$0
0
$0
1
$82,860
0
$0
0
$0
0
$0
Aggregated Statistics For Year 2004 (Based on 2 partial tracts)
A) FHA, FSA/RHS & VA Home Purchase Loans
B) Conventional Home Purchase Loans
C) Refinancings
D) Home Improvement Loans
F) Non-occupant Loans on < 5 Family Dwellings (A B C & D)
G) Loans On Manufactured Home Dwelling (A B C & D)
Number
Average Value
Number
Average Value
Number
Average Value
Number
Average Value
Number
Average Value
Number
Average Value
LOANS ORIGINATED
1
$109,720
5
$75,422
14
$73,646
3
$26,163
2
$38,080
0
$0
APPLICATIONS APPROVED, NOT ACCEPTED
0
$0
1
$77,100
3
$77,947
0
$0
0
$0
1
$27,240
APPLICATIONS DENIED
0
$0
1
$77,990
9
$77,813
2
$20,760
0
$0
0
$0
APPLICATIONS WITHDRAWN
0
$0
1
$31,850
8
$86,181
0
$0
0
$0
0
$0
FILES CLOSED FOR INCOMPLETENESS
0
$0
0
$0
1
$96,060
0
$0
0
$0
0
$0
Aggregated Statistics For Year 2003 (Based on 2 partial tracts)
A) FHA, FSA/RHS & VA Home Purchase Loans
B) Conventional Home Purchase Loans
C) Refinancings
D) Home Improvement Loans
F) Non-occupant Loans on < 5 Family Dwellings (A B C & D)
Number
Average Value
Number
Average Value
Number
Average Value
Number
Average Value
Number
Average Value
LOANS ORIGINATED
2
$107,185
4
$65,998
22
$74,952
3
$21,720
1
$65,160
APPLICATIONS APPROVED, NOT ACCEPTED
0
$0
0
$0
4
$78,842
1
$26,100
0
$0
APPLICATIONS DENIED
0
$0
2
$52,360
10
$70,986
2
$19,590
0
$0
APPLICATIONS WITHDRAWN
0
$0
1
$45,440
6
$71,668
0
$0
0
$0
FILES CLOSED FOR INCOMPLETENESS
0
$0
0
$0
1
$81,090
0
$0
0
$0
Aggregated Statistics For Year 2002 (Based on 2 partial tracts)
A) FHA, FSA/RHS & VA Home Purchase Loans
B) Conventional Home Purchase Loans
C) Refinancings
D) Home Improvement Loans
F) Non-occupant Loans on < 5 Family Dwellings (A B C & D)
Number
Average Value
Number
Average Value
Number
Average Value
Number
Average Value
Number
Average Value
LOANS ORIGINATED
2
$92,080
4
$65,838
17
$75,970
2
$10,965
2
$111,075
APPLICATIONS APPROVED, NOT ACCEPTED
0
$0
1
$39,690
3
$63,370
1
$21,610
0
$0
APPLICATIONS DENIED
0
$0
2
$61,240
8
$66,162
1
$20,160
1
$34,380
APPLICATIONS WITHDRAWN
0
$0
1
$38,800
3
$68,423
0
$0
0
$0
FILES CLOSED FOR INCOMPLETENESS
0
$0
0
$0
1
$56,060
0
$0
0
$0
Aggregated Statistics For Year 2001 (Based on 2 partial tracts)
A) FHA, FSA/RHS & VA Home Purchase Loans
B) Conventional Home Purchase Loans
C) Refinancings
D) Home Improvement Loans
F) Non-occupant Loans on < 5 Family Dwellings (A B C & D)
Number
Average Value
Number
Average Value
Number
Average Value
Number
Average Value
Number
Average Value
LOANS ORIGINATED
2
$71,195
5
$59,496
15
$63,879
3
$51,760
2
$42,375
APPLICATIONS APPROVED, NOT ACCEPTED
0
$0
1
$29,390
3
$72,260
0
$0
0
$0
APPLICATIONS DENIED
0
$0
3
$42,513
7
$62,721
2
$15,390
1
$30,400
APPLICATIONS WITHDRAWN
0
$0
0
$0
3
$61,430
0
$0
0
$0
FILES CLOSED FOR INCOMPLETENESS
0
$0
0
$0
1
$46,450
0
$0
0
$0
Aggregated Statistics For Year 2000 (Based on 2 partial tracts)
A) FHA, FSA/RHS & VA Home Purchase Loans
B) Conventional Home Purchase Loans
C) Refinancings
D) Home Improvement Loans
F) Non-occupant Loans on < 5 Family Dwellings (A B C & D)
Number
Average Value
Number
Average Value
Number
Average Value
Number
Average Value
Number
Average Value
LOANS ORIGINATED
2
$89,205
6
$54,668
9
$55,181
2
$15,265
2
$59,410
APPLICATIONS APPROVED, NOT ACCEPTED
0
$0
1
$31,790
2
$63,960
1
$6,700
0
$0
APPLICATIONS DENIED
0
$0
4
$38,458
6
$44,820
2
$14,630
0
$0
APPLICATIONS WITHDRAWN
0
$0
1
$39,880
3
$41,017
0
$0
0
$0
FILES CLOSED FOR INCOMPLETENESS
0
$0
0
$0
1
$34,510
0
$0
0
$0
Aggregated Statistics For Year 1999 (Based on 1 partial tract)
A) FHA, FSA/RHS & VA Home Purchase Loans
B) Conventional Home Purchase Loans
C) Refinancings
D) Home Improvement Loans
F) Non-occupant Loans on < 5 Family Dwellings (A B C & D)
Detailed PMIC statistics for the following Tracts:4019.02
2002 - 2018 National Fire Incident Reporting System (NFIRS) incidents
According to the data from the years 2002 - 2018 the average number of fire incidents per year is 18. The highest number of fire incidents - 27 took place in 2013, and the least - 11 in 2006. The data has a dropping trend.
When looking into fire subcategories, the most reports belonged to: Structure Fires (51.6%), and Outside Fires (32.8%).
Fire incident types reported to NFIRS in Zip Code 62087


 Nearest zip codes: 62084, 62048, 62095, 62024, 62018, 62040.


 According to the data from the years 2002 - 2018 the average number of fire incidents per year is 18. The highest number of fire incidents - 27 took place in 2013, and the least - 11 in 2006. The data has a dropping trend.
 When looking into fire subcategories, the most reports belonged to: Structure Fires (51.6%), and Outside Fires (32.8%).