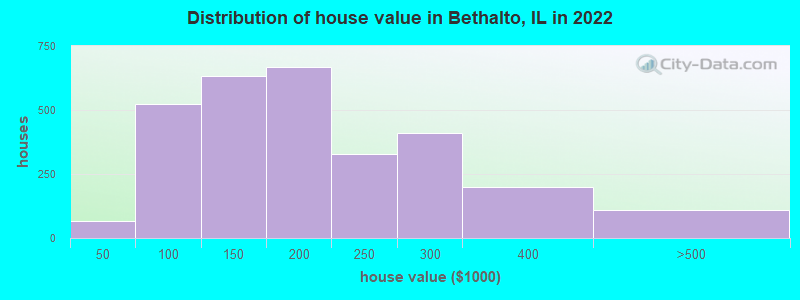
Estimated median house or condo value in 2022: $167,184 (it was $77,800 in 2000)
Bethalto:
$167,184
IL:
$251,600
Mean prices in 2022:all housing units: $227,874; detached houses: $233,185; townhouses or other attached units: $152,809; in 2-unit structures: $143,175; in 3-to-4-unit structures: $91,138; in 5-or-more-unit structures: $72,788; mobile homes: $39,452
Median gross rent in 2022: $840.
March 2022 cost of living index in Bethalto: 95.0 (less than average, U.S. average is 100)
Percentage of residents living in poverty in 2022: 9.6%
(9.7% for White Non-Hispanic residents, 9.6% for Black residents, 9.5% for two or more races residents)
According to our research of Illinois and other state lists, there were 7 registered sex offenders living in Bethalto, Illinois as of July 04, 2024. The ratio of all residents to sex offenders in Bethalto is 1,332 to 1. The ratio of registered sex offenders to all residents in this city is lower than the state average.
Crime rates in Bethalto by year
Type
2009
2010
2011
2012
2013
2014
2015
2016
2017
2018
2019
2020
2021
2022
Murders (per 100,000)
0 (0.0)
0 (0.0)
0 (0.0)
0 (0.0)
1 (10.6)
1 (10.6)
0 (0.0)
0 (0.0)
0 (0.0)
0 (0.0)
3 (32.4)
0 (0.0)
0 (0.0)
0 (0.0)
Rapes (per 100,000)
0 (0.0)
3 (31.5)
9 (94.2)
16 (168.5)
9 (95.3)
15 (159.4)
7 (74.9)
2 (21.5)
0 (0.0)
0 (0.0)
3 (32.4)
1 (10.9)
8 (87.2)
6 (64.4)
Robberies (per 100,000)
0 (0.0)
0 (0.0)
1 (10.5)
0 (0.0)
1 (10.6)
3 (31.9)
2 (21.4)
6 (64.4)
1 (10.8)
1 (10.8)
2 (21.6)
0 (0.0)
1 (10.9)
0 (0.0)
Assaults (per 100,000)
0 (0.0)
7 (73.5)
38 (397.9)
43 (452.9)
28 (296.6)
5 (53.1)
6 (64.2)
1 (10.7)
3 (32.3)
4 (43.0)
2 (21.6)
3 (32.7)
10 (109.1)
10 (107.4)
Burglaries (per 100,000)
1 (10.0)
7 (73.5)
34 (356.0)
39 (410.7)
28 (296.6)
17 (180.7)
16 (171.2)
10 (107.4)
30 (322.7)
15 (161.3)
10 (107.9)
9 (98.1)
7 (76.3)
5 (53.7)
Thefts (per 100,000)
2 (20.1)
20 (210.1)
119 (1,246)
141 (1,485)
123 (1,303)
95 (1,010)
91 (973.6)
101 (1,084)
130 (1,398)
62 (666.7)
61 (658.0)
69 (751.9)
36 (392.6)
30 (322.2)
Auto thefts (per 100,000)
0 (0.0)
1 (10.5)
6 (62.8)
4 (42.1)
6 (63.6)
3 (31.9)
8 (85.6)
4 (42.9)
6 (64.5)
4 (43.0)
4 (43.1)
4 (43.6)
8 (87.2)
5 (53.7)
Arson (per 100,000)
0 (0.0)
0 (0.0)
0 (0.0)
0 (0.0)
0 (0.0)
0 (0.0)
0 (0.0)
0 (0.0)
0 (0.0)
0 (0.0)
0 (0.0)
1 (10.9)
1 (10.9)
0 (0.0)
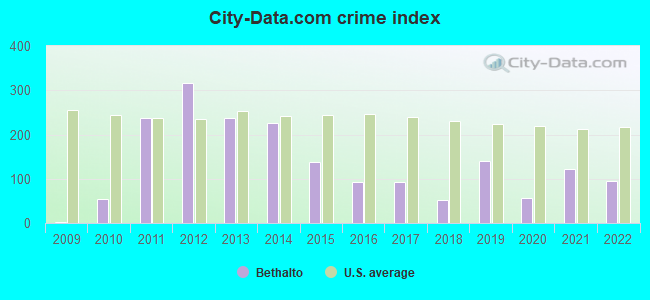
City-Data.com crime index
1.5
54.3
237.9
316.9
237.9
224.5
136.9
93.0
93.4
53.2
138.7
55.7
122.9
94.0
The City-Data.com crime index weighs serious crimes and violent crimes more heavily. Higher means more crime, U.S. average is 246.1. It adjusts for the number of visitors and daily workers commuting into cities.
Latest news from Bethalto, IL collected exclusively by city-data.com from local newspapers, TV, and radio stations
Ancestries: American (25.8%), German (22.1%), Irish (7.5%), English (7.1%), Italian (3.6%), Northern European (3.1%).
Current Local Time: CST time zone
Incorporated on 07/02/1873
Elevation: 521 feet
Land area: 6.58 square miles.
Population density: 1,401 people per square mile (low).
22 residents are foreign born
This village:
0.2%
Illinois:
14.1%
Median real estate property taxes paid for housing units with mortgages in 2022: $3,364 (2.0%) Median real estate property taxes paid for housing units with no mortgage in 2022: $2,933 (1.6%)
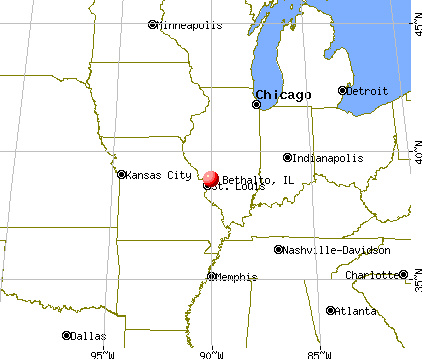
Nearest city with pop. 50,000+: Florissant, MO (16.7 miles , pop. 50,497).
Nearest city with pop. 200,000+: St. Louis, MO (21.9 miles , pop. 348,189).
Nearest city with pop. 1,000,000+: Chicago, IL (238.3 miles , pop. 2,896,016).
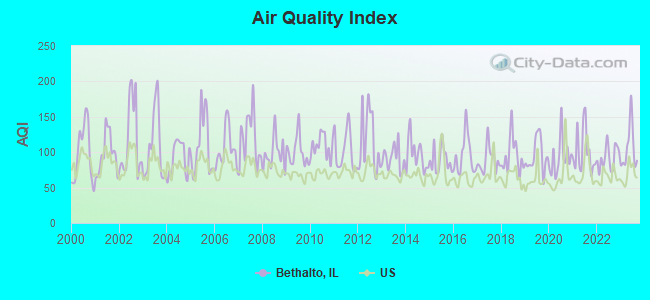
Air Quality Index (AQI) level in 2023 was 105. This is significantly worse than average.
City:
105
U.S.:
73
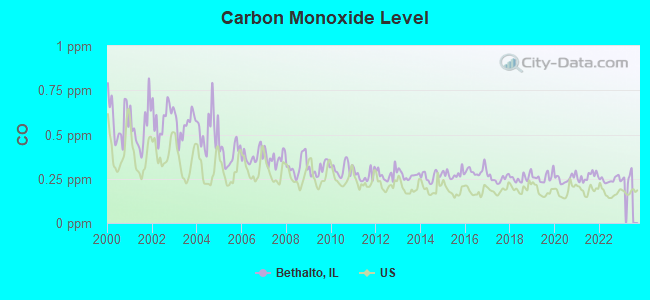
Carbon Monoxide (CO) [ppm] level in 2022 was 0.244. This is about average.Closest monitor was 4.4 miles away from the city center.
City:
0.244
U.S.:
0.251
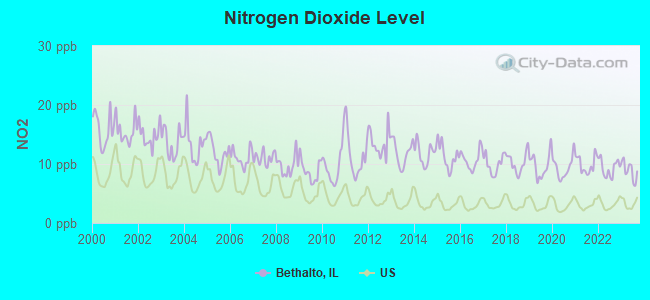
Nitrogen Dioxide (NO2) [ppb] level in 2023 was 8.89. This is significantly worse than average.Closest monitor was 4.4 miles away from the city center.
City:
8.89
U.S.:
5.11
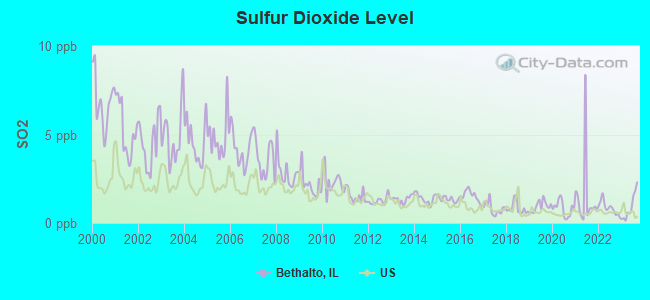
Sulfur Dioxide (SO2) [ppb] level in 2023 was 0.905. This is significantly better than average.Closest monitor was 2.9 miles away from the city center.
City:
0.905
U.S.:
1.515
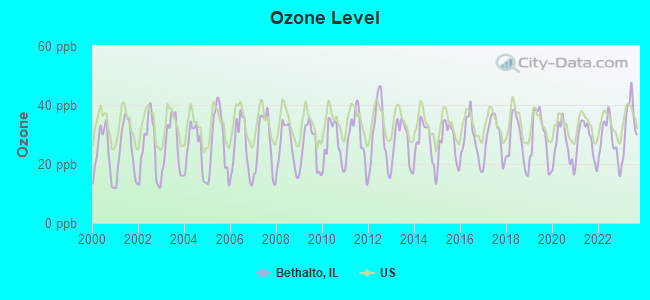
Ozone [ppb] level in 2023 was 33.8. This is about average.Closest monitor was 4.4 miles away from the city center.
City:
33.8
U.S.:
33.3
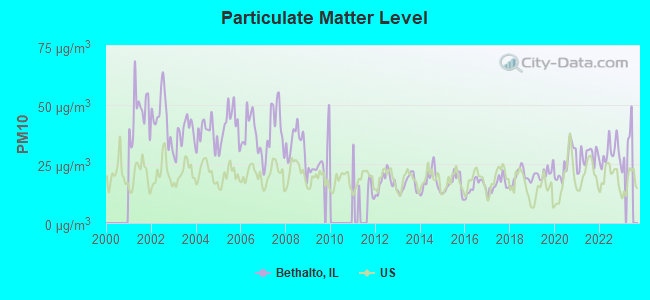
Particulate Matter (PM10) [µg/m3] level in 2022 was 29.7. This is significantly worse than average.Closest monitor was 4.4 miles away from the city center.
City:
29.7
U.S.:
19.2
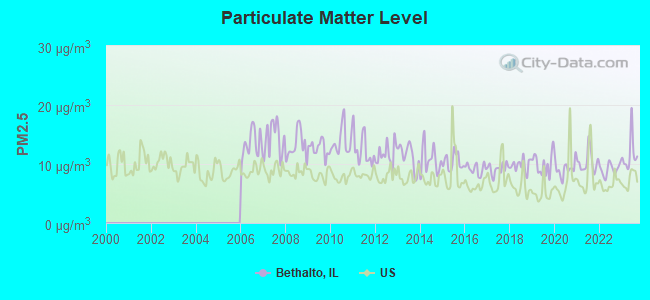
Particulate Matter (PM2.5) [µg/m3] level in 2023 was 11.6. This is significantly worse than average.Closest monitor was 4.4 miles away from the city center.
City:
11.6
U.S.:
8.1
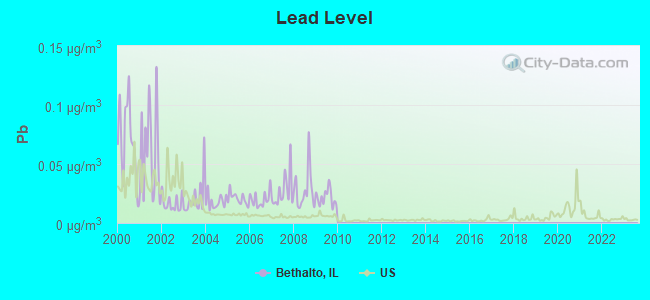
Lead (Pb) [µg/m3] level in 2009 was 0.0217. This is significantly worse than average.Closest monitor was 4.4 miles away from the city center.
City:
0.0217
U.S.:
0.0093
Tornado activity:
Bethalto-area historical tornado activity is near Illinois state average. It is 83% greater than the overall U.S. average.
On 1/24/1967, a category F4 (max. wind speeds 207-260 mph) tornado 7.0 miles away from the Bethalto village center killed 3 peopleand injured 216 peopleand causedbetween $5,000,000 and $50,000,000 in damages.
On 4/3/1981, a category F4 tornado 7.8 miles away from the village center injured 32 peopleand causedbetween $5,000,000 and $50,000,000 in damages.
Earthquake activity:
Bethalto-area historical earthquake activity is significantly above Illinois state average. It is 286% greater than the overall U.S. average.
On 4/18/2008 at 09:36:59, a magnitude 5.4 (5.1 MB, 4.8 MS, 5.4 MW, 5.2 MW, Class: Moderate, Intensity: VI - VII) earthquake occurred 120.8 miles away from Bethalto center On 4/18/2008 at 09:36:59, a magnitude 5.2 (5.2 MW, Depth: 8.9 mi) earthquake occurred 120.8 miles away from the city center On 6/10/1987 at 23:48:54, a magnitude 5.1 (4.9 MB, 4.4 MS, 4.6 MS, 5.1 LG) earthquake occurred 116.6 miles away from the city center On 9/26/1990 at 13:18:51, a magnitude 5.0 (4.7 MB, 4.8 LG, 5.0 LG, Depth: 7.7 mi) earthquake occurred 123.3 miles away from Bethalto center On 6/18/2002 at 17:37:15, a magnitude 5.0 (4.3 MB, 4.6 MW, 5.0 LG) earthquake occurred 138.2 miles away from the city center On 5/4/1991 at 01:18:54, a magnitude 5.0 (4.4 MB, 4.6 LG, 5.0 LG, Depth: 3.1 mi) earthquake occurred 162.3 miles away from Bethalto center Magnitude types: regional Lg-wave magnitude (LG), body-wave magnitude (MB), surface-wave magnitude (MS), moment magnitude (MW)
Natural disasters:
The number of natural disasters in Madison County (14) is near the US average (15). Major Disasters (Presidential) Declared: 11 Emergencies Declared: 1
Causes of natural disasters: Floods: 11, Storms: 10, Tornadoes: 3, Heavy Rain: 1, Hurricane: 1, Winter Storm: 1, Other: 1 (Note: some incidents may be assigned to more than one category).
Hospitals and medical centers in Bethalto:
BETHALTO CARE CENTER (815 SOUTH PRAIRIE STREET)
Other hospitals and medical centers near Bethalto:
THELMA TERRACE (Hospital, about 3 miles away; WOOD RIVER, IL)
LINTON TERRACE (Hospital, about 4 miles away; WOOD RIVER, IL)
PERSHING TERRACE (Hospital, about 4 miles away; WOOD RIVER, IL)
V I P MANOR (Nursing Home, about 4 miles away; WOOD RIVER, IL)
WOOD RIVER HOSPICE (Hospital, about 4 miles away; WOOD RIVER, IL)
FOSTERBURG TERRACE (Hospital, about 4 miles away; ALTON, IL)
ABERDEEN TERRACE (Hospital, about 5 miles away; ALTON, IL)
Amtrak station near Bethalto:
5 miles: ALTON (3400 COLLEGE AVE.) . Services: ticket office, fully wheelchair accessible, public payphones, vending machines, free short-term parking, free long-term parking, call for taxi service.
BETHALTO PUBLIC LIBRARY DISTRICT (Operating income: $460,154; Location: 321 SOUTH PRAIRIE STREET; 44,255 books; 1,066 audio materials; 5,100 video materials; 3 local licensed databases; 16 state licensed databases; 1 other licensed databases; 174 print serial subscriptions)
Notable locations in Bethalto: Bethalto Public Library (A), Bethalto City Hall (B), Saint Louis Regional Airport Fire Department (C), Bethalto Fire Department (D). Display/hide their locations on the map
Cemeteries: Bethalto City Cemetery (1), Rose Lawn Memory Gardens (2), Montgomery Family Cemetery (3), Preuitt Family Cemetery (4). Display/hide their locations on the map
Monitoring and Reporting (DBP) - Between JAN-2007 and MAR-2007, Contaminant: Chlorine. Follow-up actions: St Violation/Reminder Notice (FEB-15-2007), St Compliance achieved (FEB-20-2007)
One minor monitoring violation
Average household size:
This village:
2.4 people
Illinois:
2.6 people
Percentage of family households:
This village:
66.7%
Whole state:
65.8%
Percentage of households with unmarried partners:
This village:
6.8%
Whole state:
6.3%
Likely homosexual households (counted as self-reported same-sex unmarried-partner households)
Lesbian couples: 0.3% of all households
Gay men: 0.1% of all households
92 people in nursing facilities/skilled-nursing facilities in 2010
94 people in nursing homes in 2000
Banks with branches in Bethalto (2011 data):
The Bank of Edwardsville: Bethalto Rte 140 Branch at 102 East Bethalto Blvd, branch established on 2007/09/15. Info updated 2006/11/03: Bank assets: $1,559.6 mil, Deposits: $1,289.3 mil, headquarters in Edwardsville, IL, positive income, 20 total offices, Holding Company: Banc Ed Corp., The
Liberty Bank: Bethalto Branch at 353 West Bethalto Rd, branch established on 2006/11/27. Info updated 2007/08/29: Bank assets: $285.2 mil, Deposits: $234.1 mil, headquarters in Alton, IL, positive income, Commercial Lending Specialization, 4 total offices, Holding Company: Liberty Bancshares, Inc.
The First National Bank in Staunton: Bethalto Branch at 704 Texas Street, branch established on 1937/01/01. Info updated 2006/11/03: Bank assets: $480.2 mil, Deposits: $396.5 mil, headquarters in Staunton, IL, positive income, Commercial Lending Specialization, 10 total offices, Holding Company: First Staunton Bancshares, Inc.
U.S. Bank National Association: Bethalto Airport Branch at One Airport Plaza, branch established on 1976/04/07. Info updated 2012/01/30: Bank assets: $330,470.8 mil, Deposits: $236,091.5 mil, headquarters in Cincinnati, OH, positive income, 3121 total offices, Holding Company: U.S. Bancorp
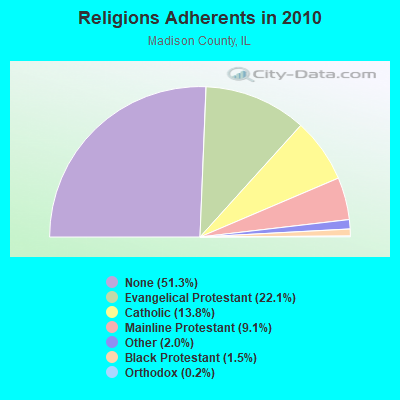
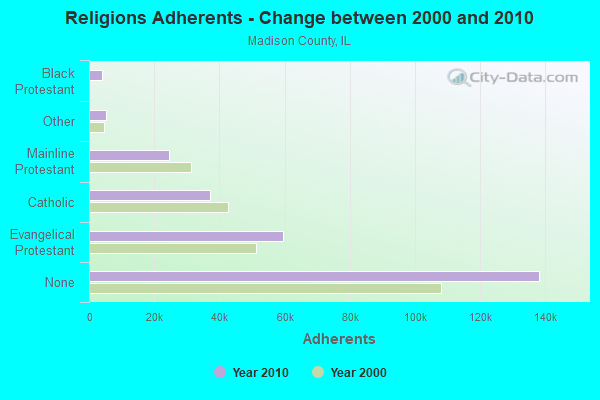
Religion statistics for Bethalto, IL (based on Madison County data)
Religion
Adherents
Congregations
Evangelical Protestant
59,455
212
Catholic
37,243
21
Mainline Protestant
24,545
79
Other
5,330
20
Black Protestant
3,942
21
Orthodox
590
4
None
138,177
-
Source: Clifford Grammich, Kirk Hadaway, Richard Houseal, Dale E.Jones, Alexei Krindatch, Richie Stanley and Richard H.Taylor. 2012. 2010 U.S.Religion Census: Religious Congregations & Membership Study. Association of Statisticians of American Religious Bodies. Jones, Dale E., et al. 2002. Congregations and Membership in the United States 2000. Nashville, TN: Glenmary Research Center. Graphs represent county-level data
Aircraft: BOEING A75N1 (Category: Land, Seats: 2, Weight: Up to 12,499 Pounds), Engine: CONT MOTOR W670 SERIES (250 HP) (Reciprocating) N-Number: 1942P, N1942P, N-1942P, Serial Number: 75-4842, Year manufactured: 1943, Airworthiness Date: 06/12/1998, Certificate Issue Date: 09/09/2015 Registrant (Individual): Todd E Helmkamp, 476 Sheridan St Unit A, Bethalto, IL 62010
Aircraft: HELMKAMP EUGENE E RV6A (Category: Land, Seats: 2, Weight: Up to 12,499 Pounds), Engine: LYCOMING 0-320 SERIES (180 HP) (Reciprocating) N-Number: 20579, N20579, N-20579, Serial Number: 23326, Year manufactured: 2003, Airworthiness Date: 07/14/2003, Certificate Issue Date: 03/21/2002 Registrant (Individual): Eugene E Helmkamp, 79 Brooks Dr, Bethalto, IL 62010
Aircraft: ROHR IRVING C RV 4-VANS AIRCRAFT (Category: Land, Seats: 2, Weight: Up to 12,499 Pounds), Engine: LYCOMING I0360 SER (180 HP) (Reciprocating) N-Number: 425R, N425R, N-425R, Serial Number: 124, Year manufactured: 1995, Airworthiness Date: 03/15/1996, Certificate Issue Date: 07/13/2012 Registrant (Co-Owned): Eugene E Helmkamp, 79 Brooks Dr, Bethalto, IL 62010, Other Owners: Janet K Helmkamp
Aircraft: BOEING E75N1 (Category: Land, Seats: 2, Weight: Up to 12,499 Pounds, Speed: 93 mph), Engine: LYCOMING R680 (215 HP) (Reciprocating) N-Number: 57941, N57941, N-57941, Serial Number: 75-1860, Airworthiness Date: 08/17/1984, Certificate Issue Date: 09/15/2010 Registrant (Corporation): Metropolitan Registered Pharmacists Inc, 304 N Old Bethalto Rd, Bethalto, IL 62010
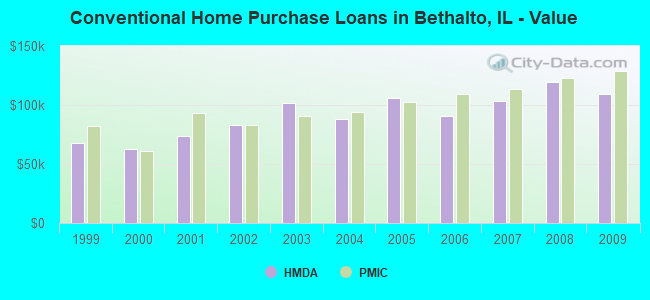
Home Mortgage Disclosure Act Aggregated Statistics For Year 2009 (Based on 1 full and 3 partial tracts)
A) FHA, FSA/RHS & VA Home Purchase Loans
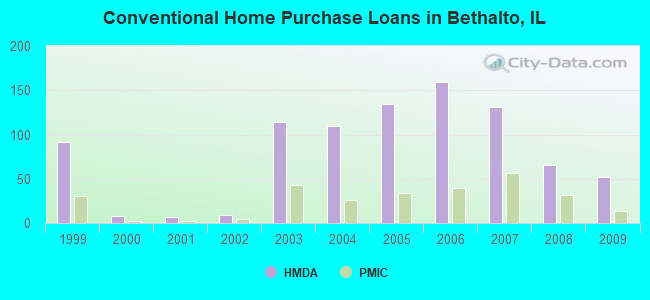
B) Conventional Home Purchase Loans
C) Refinancings
D) Home Improvement Loans
E) Loans on Dwellings For 5+ Families
F) Non-occupant Loans on < 5 Family Dwellings (A B C & D)
G) Loans On Manufactured Home Dwelling (A B C & D)
Number
Average Value
Number
Average Value
Number
Average Value
Number
Average Value
Number
Average Value
Number
Average Value
Number
Average Value
LOANS ORIGINATED
58
$106,341
52
$109,634
281
$115,915
20
$27,439
1
$139,260
22
$94,016
1
$30,570
APPLICATIONS APPROVED, NOT ACCEPTED
1
$160,520
3
$87,393
15
$103,022
4
$10,832
0
$0
0
$0
0
$0
APPLICATIONS DENIED
4
$141,672
3
$77,117
47
$113,526
11
$26,553
0
$0
2
$62,200
1
$36,840
APPLICATIONS WITHDRAWN
3
$110,630
7
$103,560
39
$103,901
2
$22,340
0
$0
3
$75,813
0
$0
FILES CLOSED FOR INCOMPLETENESS
0
$0
0
$0
5
$127,866
0
$0
0
$0
0
$0
0
$0
Aggregated Statistics For Year 2008 (Based on 1 full and 3 partial tracts)
A) FHA, FSA/RHS & VA Home Purchase Loans
B) Conventional Home Purchase Loans
C) Refinancings
D) Home Improvement Loans
E) Loans on Dwellings For 5+ Families
F) Non-occupant Loans on < 5 Family Dwellings (A B C & D)
G) Loans On Manufactured Home Dwelling (A B C & D)
Number
Average Value
Number
Average Value
Number
Average Value
Number
Average Value
Number
Average Value
Number
Average Value
Number
Average Value
LOANS ORIGINATED
37
$116,284
65
$119,114
180
$117,582
13
$27,428
5
$241,688
36
$130,500
0
$0
APPLICATIONS APPROVED, NOT ACCEPTED
4
$109,682
7
$128,833
19
$104,339
2
$23,835
0
$0
4
$74,620
1
$52,720
APPLICATIONS DENIED
2
$77,615
7
$116,147
54
$99,737
18
$52,797
0
$0
4
$74,218
0
$0
APPLICATIONS WITHDRAWN
5
$160,488
9
$84,634
35
$106,199
5
$71,798
2
$259,440
2
$73,505
0
$0
FILES CLOSED FOR INCOMPLETENESS
1
$71,330
0
$0
9
$92,954
0
$0
0
$0
0
$0
0
$0
Aggregated Statistics For Year 2007 (Based on 1 full and 3 partial tracts)
A) FHA, FSA/RHS & VA Home Purchase Loans
B) Conventional Home Purchase Loans
C) Refinancings
D) Home Improvement Loans
E) Loans on Dwellings For 5+ Families
F) Non-occupant Loans on < 5 Family Dwellings (A B C & D)
G) Loans On Manufactured Home Dwelling (A B C & D)
Number
Average Value
Number
Average Value
Number
Average Value
Number
Average Value
Number
Average Value
Number
Average Value
Number
Average Value
LOANS ORIGINATED
16
$95,970
131
$103,144
158
$99,030
41
$34,728
2
$251,660
30
$87,673
0
$0
APPLICATIONS APPROVED, NOT ACCEPTED
1
$97,190
8
$110,110
19
$114,852
9
$41,136
0
$0
1
$54,870
0
$0
APPLICATIONS DENIED
2
$111,405
31
$107,277
108
$110,330
23
$49,493
0
$0
4
$52,540
1
$20,380
APPLICATIONS WITHDRAWN
4
$75,545
16
$112,519
41
$100,552
6
$79,268
0
$0
2
$94,450
0
$0
FILES CLOSED FOR INCOMPLETENESS
0
$0
2
$69,825
10
$117,266
1
$14,960
0
$0
1
$73,680
0
$0
Aggregated Statistics For Year 2006 (Based on 1 full and 3 partial tracts)
A) FHA, FSA/RHS & VA Home Purchase Loans
B) Conventional Home Purchase Loans
C) Refinancings
D) Home Improvement Loans
E) Loans on Dwellings For 5+ Families
F) Non-occupant Loans on < 5 Family Dwellings (A B C & D)
G) Loans On Manufactured Home Dwelling (A B C & D)
Number
Average Value
Number
Average Value
Number
Average Value
Number
Average Value
Number
Average Value
Number
Average Value
Number
Average Value
LOANS ORIGINATED
14
$101,747
159
$90,999
178
$94,624
25
$42,345
1
$98,760
27
$66,736
0
$0
APPLICATIONS APPROVED, NOT ACCEPTED
0
$0
14
$85,932
29
$108,872
4
$32,615
0
$0
3
$76,090
3
$66,720
APPLICATIONS DENIED
4
$93,075
36
$93,725
98
$95,156
19
$68,933
0
$0
2
$71,620
3
$119,733
APPLICATIONS WITHDRAWN
0
$0
13
$101,361
53
$120,878
4
$81,675
0
$0
3
$109,733
0
$0
FILES CLOSED FOR INCOMPLETENESS
0
$0
4
$95,748
9
$102,420
2
$90,210
0
$0
1
$45,180
0
$0
Aggregated Statistics For Year 2005 (Based on 1 full and 3 partial tracts)
A) FHA, FSA/RHS & VA Home Purchase Loans
B) Conventional Home Purchase Loans
C) Refinancings
D) Home Improvement Loans
E) Loans on Dwellings For 5+ Families
F) Non-occupant Loans on < 5 Family Dwellings (A B C & D)
G) Loans On Manufactured Home Dwelling (A B C & D)
Number
Average Value
Number
Average Value
Number
Average Value
Number
Average Value
Number
Average Value
Number
Average Value
Number
Average Value
LOANS ORIGINATED
24
$108,915
135
$105,807
179
$100,341
27
$46,867
2
$91,705
27
$60,137
0
$0
APPLICATIONS APPROVED, NOT ACCEPTED
1
$58,810
14
$90,506
31
$94,165
6
$13,497
0
$0
2
$27,155
0
$0
APPLICATIONS DENIED
0
$0
39
$64,899
104
$108,024
21
$37,443
0
$0
7
$40,721
8
$41,571
APPLICATIONS WITHDRAWN
1
$87,790
16
$83,072
84
$105,593
10
$165,022
0
$0
4
$59,270
0
$0
FILES CLOSED FOR INCOMPLETENESS
0
$0
9
$58,004
15
$100,833
2
$68,975
0
$0
1
$15,680
0
$0
Aggregated Statistics For Year 2004 (Based on 1 full and 3 partial tracts)
A) FHA, FSA/RHS & VA Home Purchase Loans
B) Conventional Home Purchase Loans
C) Refinancings
D) Home Improvement Loans
E) Loans on Dwellings For 5+ Families
F) Non-occupant Loans on < 5 Family Dwellings (A B C & D)
G) Loans On Manufactured Home Dwelling (A B C & D)
Number
Average Value
Number
Average Value
Number
Average Value
Number
Average Value
Number
Average Value
Number
Average Value
Number
Average Value
LOANS ORIGINATED
28
$87,604
110
$88,091
208
$88,479
21
$30,738
1
$137,290
30
$70,646
2
$108,180
APPLICATIONS APPROVED, NOT ACCEPTED
0
$0
10
$89,972
32
$90,889
2
$83,340
0
$0
2
$34,095
1
$33,740
APPLICATIONS DENIED
5
$94,012
23
$59,776
89
$84,810
17
$26,106
0
$0
4
$69,428
8
$43,886
APPLICATIONS WITHDRAWN
2
$60,150
5
$66,430
68
$95,889
3
$6,530
0
$0
1
$62,760
0
$0
FILES CLOSED FOR INCOMPLETENESS
0
$0
4
$86,332
8
$89,622
1
$19,610
0
$0
0
$0
0
$0
Aggregated Statistics For Year 2003 (Based on 1 full and 3 partial tracts)
A) FHA, FSA/RHS & VA Home Purchase Loans
B) Conventional Home Purchase Loans
C) Refinancings
D) Home Improvement Loans
F) Non-occupant Loans on < 5 Family Dwellings (A B C & D)
Number
Average Value
Number
Average Value
Number
Average Value
Number
Average Value
Number
Average Value
LOANS ORIGINATED
33
$85,916
114
$101,782
478
$85,981
15
$19,031
48
$72,034
APPLICATIONS APPROVED, NOT ACCEPTED
3
$100,110
4
$98,430
51
$89,167
2
$21,590
0
$0
APPLICATIONS DENIED
5
$96,890
13
$82,011
114
$86,177
7
$57,180
8
$61,285
APPLICATIONS WITHDRAWN
0
$0
18
$77,679
69
$80,570
0
$0
1
$39,200
FILES CLOSED FOR INCOMPLETENESS
2
$74,460
2
$72,615
10
$69,594
0
$0
0
$0
Aggregated Statistics For Year 2002 (Based on 2 partial tracts)
A) FHA, FSA/RHS & VA Home Purchase Loans
B) Conventional Home Purchase Loans
C) Refinancings
D) Home Improvement Loans
Number
Average Value
Number
Average Value
Number
Average Value
Number
Average Value
LOANS ORIGINATED
1
$84,630
9
$82,854
29
$89,267
1
$42,000
APPLICATIONS APPROVED, NOT ACCEPTED
0
$0
0
$0
2
$63,055
0
$0
APPLICATIONS DENIED
0
$0
0
$0
4
$88,842
1
$21,960
APPLICATIONS WITHDRAWN
0
$0
0
$0
4
$87,735
0
$0
FILES CLOSED FOR INCOMPLETENESS
0
$0
0
$0
0
$0
0
$0
Aggregated Statistics For Year 2001 (Based on 2 partial tracts)
A) FHA, FSA/RHS & VA Home Purchase Loans
B) Conventional Home Purchase Loans
C) Refinancings
D) Home Improvement Loans
F) Non-occupant Loans on < 5 Family Dwellings (A B C & D)
Number
Average Value
Number
Average Value
Number
Average Value
Number
Average Value
Number
Average Value
LOANS ORIGINATED
1
$108,440
7
$73,536
24
$78,209
3
$12,650
4
$48,262
APPLICATIONS APPROVED, NOT ACCEPTED
0
$0
0
$0
1
$94,550
0
$0
0
$0
APPLICATIONS DENIED
0
$0
0
$0
5
$72,828
1
$14,650
0
$0
APPLICATIONS WITHDRAWN
0
$0
1
$73,010
3
$63,570
0
$0
0
$0
FILES CLOSED FOR INCOMPLETENESS
0
$0
0
$0
0
$0
0
$0
0
$0
Aggregated Statistics For Year 2000 (Based on 2 partial tracts)
A) FHA, FSA/RHS & VA Home Purchase Loans
B) Conventional Home Purchase Loans
C) Refinancings
D) Home Improvement Loans
F) Non-occupant Loans on < 5 Family Dwellings (A B C & D)
Number
Average Value
Number
Average Value
Number
Average Value
Number
Average Value
Number
Average Value
LOANS ORIGINATED
1
$114,000
8
$62,590
7
$65,974
2
$10,590
1
$31,180
APPLICATIONS APPROVED, NOT ACCEPTED
0
$0
1
$55,360
2
$84,625
0
$0
0
$0
APPLICATIONS DENIED
0
$0
3
$98,563
2
$80,030
1
$11,850
0
$0
APPLICATIONS WITHDRAWN
0
$0
1
$59,800
2
$62,060
0
$0
0
$0
FILES CLOSED FOR INCOMPLETENESS
0
$0
0
$0
0
$0
0
$0
0
$0
Aggregated Statistics For Year 1999 (Based on 2 partial tracts)
A) FHA, FSA/RHS & VA Home Purchase Loans
B) Conventional Home Purchase Loans
C) Refinancings
D) Home Improvement Loans
E) Loans on Dwellings For 5+ Families
F) Non-occupant Loans on < 5 Family Dwellings (A B C & D)
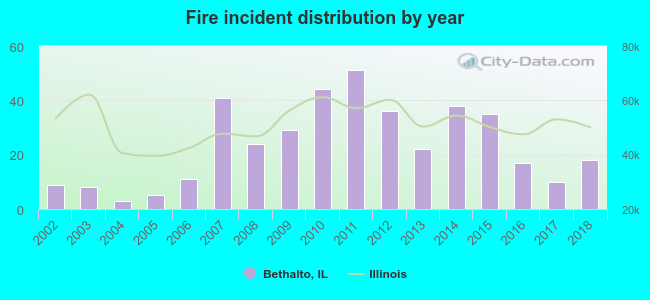
2002 - 2018 National Fire Incident Reporting System (NFIRS) incidents
Based on the data from the years 2002 - 2018 the average number of fire incidents per year is 24. The highest number of fire incidents - 51 took place in 2011, and the least - 3 in 2004. The data has an increasing trend.
When looking into fire subcategories, the most incidents belonged to: Structure Fires (54.4%), and Outside Fires (23.7%).
Fire incident types reported to NFIRS in Bethalto, IL
#15 on the list of "Top 101 cities with the highest number of rapes per 100,000 residents, excludes tourist destinations and others with a lot of outsiders visiting based on city industries data (population 5,000+)"
#40 on the list of "Top 101 cities with the largest city-data.com crime index increase from 2002 to 2012 (population 5,000+)"
#12 on the list of "Top 101 counties with the largest decrease in the number of infant deaths per 1000 residents 2000-2006 to 2007-2013 (pop. 50,000+)"
#18 on the list of "Top 101 counties with the lowest number of infant deaths per 1000 residents 2007-2013 (pop. 50,000+)"
#26 on the list of "Top 101 counties with the highest Particulate Matter (PM2.5) Annual air pollution readings in 2012 (µg/m3)"
#67 on the list of "Top 101 counties with the lowest percentage of residents relocating from foreign countries between 2010 and 2011"


 Recent articles from our blog. Our writers, many of them Ph.D. graduates or candidates, create easy-to-read articles on a wide variety of topics.

 (16.7 miles


 Based on the data from the years 2002 - 2018 the average number of fire incidents per year is 24. The highest number of fire incidents - 51 took place in 2011, and the least - 3 in 2004. The data has an increasing trend.
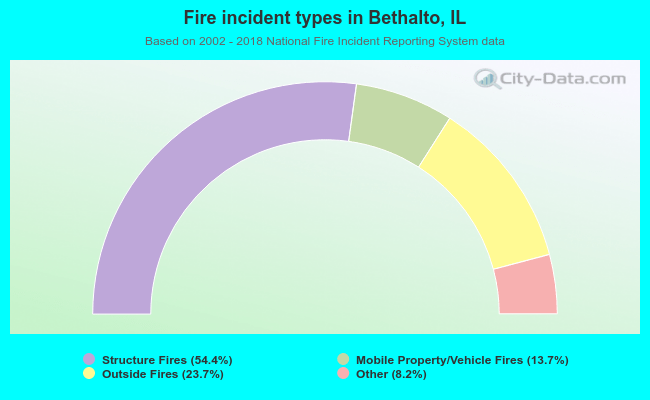 When looking into fire subcategories, the most incidents belonged to: Structure Fires (54.4%), and Outside Fires (23.7%).