Pulaski, New York Submit your own pictures of this village and show them to the world
OSM Map
General Map
Google Map
MSN Map
OSM Map
General Map
Google Map
MSN Map
OSM Map
General Map
Google Map
MSN Map
OSM Map
General Map
Google Map
MSN Map
Please wait while loading the map...
Population in 2022: 2,286 (0% urban, 100% rural). Population change since 2000: -4.7%Males: 1,100 Females: 1,186
March 2022 cost of living index in Pulaski: 94.3 (less than average, U.S. average is 100) Percentage of residents living in poverty in 2022: 13.9%for White Non-Hispanic residents , 28.6% for Black residents )
Profiles of local businesses
Business Search - 14 Million verified businesses
Data:
Median household income ($)
Median household income (% change since 2000)
Household income diversity
Ratio of average income to average house value (%)
Ratio of average income to average rent
Median household income ($) - White
Median household income ($) - Black or African American
Median household income ($) - Asian
Median household income ($) - Hispanic or Latino
Median household income ($) - American Indian and Alaska Native
Median household income ($) - Multirace
Median household income ($) - Other Race
Median household income for houses/condos with a mortgage ($)
Median household income for apartments without a mortgage ($)
Races - White alone (%)
Races - White alone (% change since 2000)
Races - Black alone (%)
Races - Black alone (% change since 2000)
Races - American Indian alone (%)
Races - American Indian alone (% change since 2000)
Races - Asian alone (%)
Races - Asian alone (% change since 2000)
Races - Hispanic (%)
Races - Hispanic (% change since 2000)
Races - Native Hawaiian and Other Pacific Islander alone (%)
Races - Native Hawaiian and Other Pacific Islander alone (% change since 2000)
Races - Two or more races (%)
Races - Two or more races (% change since 2000)
Races - Other race alone (%)
Races - Other race alone (% change since 2000)
Racial diversity
Unemployment (%)
Unemployment (% change since 2000)
Unemployment (%) - White
Unemployment (%) - Black or African American
Unemployment (%) - Asian
Unemployment (%) - Hispanic or Latino
Unemployment (%) - American Indian and Alaska Native
Unemployment (%) - Multirace
Unemployment (%) - Other Race
Population density (people per square mile)
Population - Males (%)
Population - Females (%)
Population - Males (%) - White
Population - Males (%) - Black or African American
Population - Males (%) - Asian
Population - Males (%) - Hispanic or Latino
Population - Males (%) - American Indian and Alaska Native
Population - Males (%) - Multirace
Population - Males (%) - Other Race
Population - Females (%) - White
Population - Females (%) - Black or African American
Population - Females (%) - Asian
Population - Females (%) - Hispanic or Latino
Population - Females (%) - American Indian and Alaska Native
Population - Females (%) - Multirace
Population - Females (%) - Other Race
Coronavirus confirmed cases (Jul 03, 2024)
Deaths caused by coronavirus (Jul 03, 2024)
Coronavirus confirmed cases (per 100k population) (Jul 03, 2024)
Deaths caused by coronavirus (per 100k population) (Jul 03, 2024)
Daily increase in number of cases (Jul 03, 2024)
Weekly increase in number of cases (Jul 03, 2024)
Cases doubled (in days) (Jul 03, 2024)
Hospitalized patients (Apr 18, 2022)
Negative test results (Apr 18, 2022)
Total test results (Apr 18, 2022)
COVID Vaccine doses distributed (per 100k population) (Sep 19, 2023)
COVID Vaccine doses administered (per 100k population) (Sep 19, 2023)
COVID Vaccine doses distributed (Sep 19, 2023)
COVID Vaccine doses administered (Sep 19, 2023)
Likely homosexual households (%)
Likely homosexual households (% change since 2000)
Likely homosexual households - Lesbian couples (%)
Likely homosexual households - Lesbian couples (% change since 2000)
Likely homosexual households - Gay men (%)
Likely homosexual households - Gay men (% change since 2000)
Cost of living index
Median gross rent ($)
Median contract rent ($)
Median monthly housing costs ($)
Median house or condo value ($)
Median house or condo value ($ change since 2000)
Mean house or condo value by units in structure - 1, detached ($)
Mean house or condo value by units in structure - 1, attached ($)
Mean house or condo value by units in structure - 2 ($)
Mean house or condo value by units in structure by units in structure - 3 or 4 ($)
Mean house or condo value by units in structure - 5 or more ($)
Mean house or condo value by units in structure - Boat, RV, van, etc. ($)
Mean house or condo value by units in structure - Mobile home ($)
Median house or condo value ($) - White
Median house or condo value ($) - Black or African American
Median house or condo value ($) - Asian
Median house or condo value ($) - Hispanic or Latino
Median house or condo value ($) - American Indian and Alaska Native
Median house or condo value ($) - Multirace
Median house or condo value ($) - Other Race
Median resident age
Resident age diversity
Median resident age - Males
Median resident age - Females
Median resident age - White
Median resident age - Black or African American
Median resident age - Asian
Median resident age - Hispanic or Latino
Median resident age - American Indian and Alaska Native
Median resident age - Multirace
Median resident age - Other Race
Median resident age - Males - White
Median resident age - Males - Black or African American
Median resident age - Males - Asian
Median resident age - Males - Hispanic or Latino
Median resident age - Males - American Indian and Alaska Native
Median resident age - Males - Multirace
Median resident age - Males - Other Race
Median resident age - Females - White
Median resident age - Females - Black or African American
Median resident age - Females - Asian
Median resident age - Females - Hispanic or Latino
Median resident age - Females - American Indian and Alaska Native
Median resident age - Females - Multirace
Median resident age - Females - Other Race
Commute - mean travel time to work (minutes)
Travel time to work - Less than 5 minutes (%)
Travel time to work - Less than 5 minutes (% change since 2000)
Travel time to work - 5 to 9 minutes (%)
Travel time to work - 5 to 9 minutes (% change since 2000)
Travel time to work - 10 to 19 minutes (%)
Travel time to work - 10 to 19 minutes (% change since 2000)
Travel time to work - 20 to 29 minutes (%)
Travel time to work - 20 to 29 minutes (% change since 2000)
Travel time to work - 30 to 39 minutes (%)
Travel time to work - 30 to 39 minutes (% change since 2000)
Travel time to work - 40 to 59 minutes (%)
Travel time to work - 40 to 59 minutes (% change since 2000)
Travel time to work - 60 to 89 minutes (%)
Travel time to work - 60 to 89 minutes (% change since 2000)
Travel time to work - 90 or more minutes (%)
Travel time to work - 90 or more minutes (% change since 2000)
Marital status - Never married (%)
Marital status - Now married (%)
Marital status - Separated (%)
Marital status - Widowed (%)
Marital status - Divorced (%)
Median family income ($)
Median family income (% change since 2000)
Median non-family income ($)
Median non-family income (% change since 2000)
Median per capita income ($)
Median per capita income (% change since 2000)
Median family income ($) - White
Median family income ($) - Black or African American
Median family income ($) - Asian
Median family income ($) - Hispanic or Latino
Median family income ($) - American Indian and Alaska Native
Median family income ($) - Multirace
Median family income ($) - Other Race
Median year house/condo built
Median year apartment built
Year house built - Built 2005 or later (%)
Year house built - Built 2000 to 2004 (%)
Year house built - Built 1990 to 1999 (%)
Year house built - Built 1980 to 1989 (%)
Year house built - Built 1970 to 1979 (%)
Year house built - Built 1960 to 1969 (%)
Year house built - Built 1950 to 1959 (%)
Year house built - Built 1940 to 1949 (%)
Year house built - Built 1939 or earlier (%)
Average household size
Household density (households per square mile)
Average household size - White
Average household size - Black or African American
Average household size - Asian
Average household size - Hispanic or Latino
Average household size - American Indian and Alaska Native
Average household size - Multirace
Average household size - Other Race
Occupied housing units (%)
Vacant housing units (%)
Owner occupied housing units (%)
Renter occupied housing units (%)
Vacancy status - For rent (%)
Vacancy status - For sale only (%)
Vacancy status - Rented or sold, not occupied (%)
Vacancy status - For seasonal, recreational, or occasional use (%)
Vacancy status - For migrant workers (%)
Vacancy status - Other vacant (%)
Residents with income below the poverty level (%)
Residents with income below 50% of the poverty level (%)
Children below poverty level (%)
Poor families by family type - Married-couple family (%)
Poor families by family type - Male, no wife present (%)
Poor families by family type - Female, no husband present (%)
Poverty status for native-born residents (%)
Poverty status for foreign-born residents (%)
Poverty among high school graduates not in families (%)
Poverty among people who did not graduate high school not in families (%)
Residents with income below the poverty level (%) - White
Residents with income below the poverty level (%) - Black or African American
Residents with income below the poverty level (%) - Asian
Residents with income below the poverty level (%) - Hispanic or Latino
Residents with income below the poverty level (%) - American Indian and Alaska Native
Residents with income below the poverty level (%) - Multirace
Residents with income below the poverty level (%) - Other Race
Air pollution - Air Quality Index (AQI)
Air pollution - CO
Air pollution - NO2
Air pollution - SO2
Air pollution - Ozone
Air pollution - PM10
Air pollution - PM25
Air pollution - Pb
Crime - Murders per 100,000 population
Crime - Rapes per 100,000 population
Crime - Robberies per 100,000 population
Crime - Assaults per 100,000 population
Crime - Burglaries per 100,000 population
Crime - Thefts per 100,000 population
Crime - Auto thefts per 100,000 population
Crime - Arson per 100,000 population
Crime - City-data.com crime index
Crime - Violent crime index
Crime - Property crime index
Crime - Murders per 100,000 population (5 year average)
Crime - Rapes per 100,000 population (5 year average)
Crime - Robberies per 100,000 population (5 year average)
Crime - Assaults per 100,000 population (5 year average)
Crime - Burglaries per 100,000 population (5 year average)
Crime - Thefts per 100,000 population (5 year average)
Crime - Auto thefts per 100,000 population (5 year average)
Crime - Arson per 100,000 population (5 year average)
Crime - City-data.com crime index (5 year average)
Crime - Violent crime index (5 year average)
Crime - Property crime index (5 year average)
1996 Presidential Elections Results (%) - Democratic Party (Clinton)
1996 Presidential Elections Results (%) - Republican Party (Dole)
1996 Presidential Elections Results (%) - Other
2000 Presidential Elections Results (%) - Democratic Party (Gore)
2000 Presidential Elections Results (%) - Republican Party (Bush)
2000 Presidential Elections Results (%) - Other
2004 Presidential Elections Results (%) - Democratic Party (Kerry)
2004 Presidential Elections Results (%) - Republican Party (Bush)
2004 Presidential Elections Results (%) - Other
2008 Presidential Elections Results (%) - Democratic Party (Obama)
2008 Presidential Elections Results (%) - Republican Party (McCain)
2008 Presidential Elections Results (%) - Other
2012 Presidential Elections Results (%) - Democratic Party (Obama)
2012 Presidential Elections Results (%) - Republican Party (Romney)
2012 Presidential Elections Results (%) - Other
2016 Presidential Elections Results (%) - Democratic Party (Clinton)
2016 Presidential Elections Results (%) - Republican Party (Trump)
2016 Presidential Elections Results (%) - Other
2020 Presidential Elections Results (%) - Democratic Party (Biden)
2020 Presidential Elections Results (%) - Republican Party (Trump)
2020 Presidential Elections Results (%) - Other
Ancestries Reported - Arab (%)
Ancestries Reported - Czech (%)
Ancestries Reported - Danish (%)
Ancestries Reported - Dutch (%)
Ancestries Reported - English (%)
Ancestries Reported - French (%)
Ancestries Reported - French Canadian (%)
Ancestries Reported - German (%)
Ancestries Reported - Greek (%)
Ancestries Reported - Hungarian (%)
Ancestries Reported - Irish (%)
Ancestries Reported - Italian (%)
Ancestries Reported - Lithuanian (%)
Ancestries Reported - Norwegian (%)
Ancestries Reported - Polish (%)
Ancestries Reported - Portuguese (%)
Ancestries Reported - Russian (%)
Ancestries Reported - Scotch-Irish (%)
Ancestries Reported - Scottish (%)
Ancestries Reported - Slovak (%)
Ancestries Reported - Subsaharan African (%)
Ancestries Reported - Swedish (%)
Ancestries Reported - Swiss (%)
Ancestries Reported - Ukrainian (%)
Ancestries Reported - United States (%)
Ancestries Reported - Welsh (%)
Ancestries Reported - West Indian (%)
Ancestries Reported - Other (%)
Educational Attainment - No schooling completed (%)
Educational Attainment - Less than high school (%)
Educational Attainment - High school or equivalent (%)
Educational Attainment - Less than 1 year of college (%)
Educational Attainment - 1 or more years of college (%)
Educational Attainment - Associate degree (%)
Educational Attainment - Bachelor's degree (%)
Educational Attainment - Master's degree (%)
Educational Attainment - Professional school degree (%)
Educational Attainment - Doctorate degree (%)
School Enrollment - Nursery, preschool (%)
School Enrollment - Kindergarten (%)
School Enrollment - Grade 1 to 4 (%)
School Enrollment - Grade 5 to 8 (%)
School Enrollment - Grade 9 to 12 (%)
School Enrollment - College undergrad (%)
School Enrollment - Graduate or professional (%)
School Enrollment - Not enrolled in school (%)
School enrollment - Public schools (%)
School enrollment - Private schools (%)
School enrollment - Not enrolled (%)
Median number of rooms in houses and condos
Median number of rooms in apartments
Housing units lacking complete plumbing facilities (%)
Housing units lacking complete kitchen facilities (%)
Density of houses
Urban houses (%)
Rural houses (%)
Households with people 60 years and over (%)
Households with people 65 years and over (%)
Households with people 75 years and over (%)
Households with one or more nonrelatives (%)
Households with no nonrelatives (%)
Population in households (%)
Family households (%)
Nonfamily households (%)
Population in families (%)
Family households with own children (%)
Median number of bedrooms in owner occupied houses
Mean number of bedrooms in owner occupied houses
Median number of bedrooms in renter occupied houses
Mean number of bedrooms in renter occupied houses
Median number of vehichles in owner occupied houses
Mean number of vehichles in owner occupied houses
Median number of vehichles in renter occupied houses
Mean number of vehichles in renter occupied houses
Mortgage status - with mortgage (%)
Mortgage status - with second mortgage (%)
Mortgage status - with home equity loan (%)
Mortgage status - with both second mortgage and home equity loan (%)
Mortgage status - without a mortgage (%)
Average family size
Average family size - White
Average family size - Black or African American
Average family size - Asian
Average family size - Hispanic or Latino
Average family size - American Indian and Alaska Native
Average family size - Multirace
Average family size - Other Race
Geographical mobility - Same house 1 year ago (%)
Geographical mobility - Moved within same county (%)
Geographical mobility - Moved from different county within same state (%)
Geographical mobility - Moved from different state (%)
Geographical mobility - Moved from abroad (%)
Place of birth - Born in state of residence (%)
Place of birth - Born in other state (%)
Place of birth - Native, outside of US (%)
Place of birth - Foreign born (%)
Housing units in structures - 1, detached (%)
Housing units in structures - 1, attached (%)
Housing units in structures - 2 (%)
Housing units in structures - 3 or 4 (%)
Housing units in structures - 5 to 9 (%)
Housing units in structures - 10 to 19 (%)
Housing units in structures - 20 to 49 (%)
Housing units in structures - 50 or more (%)
Housing units in structures - Mobile home (%)
Housing units in structures - Boat, RV, van, etc. (%)
House/condo owner moved in on average (years ago)
Renter moved in on average (years ago)
Year householder moved into unit - Moved in 1999 to March 2000 (%)
Year householder moved into unit - Moved in 1995 to 1998 (%)
Year householder moved into unit - Moved in 1990 to 1994 (%)
Year householder moved into unit - Moved in 1980 to 1989 (%)
Year householder moved into unit - Moved in 1970 to 1979 (%)
Year householder moved into unit - Moved in 1969 or earlier (%)
Means of transportation to work - Drove car alone (%)
Means of transportation to work - Carpooled (%)
Means of transportation to work - Public transportation (%)
Means of transportation to work - Bus or trolley bus (%)
Means of transportation to work - Streetcar or trolley car (%)
Means of transportation to work - Subway or elevated (%)
Means of transportation to work - Railroad (%)
Means of transportation to work - Ferryboat (%)
Means of transportation to work - Taxicab (%)
Means of transportation to work - Motorcycle (%)
Means of transportation to work - Bicycle (%)
Means of transportation to work - Walked (%)
Means of transportation to work - Other means (%)
Working at home (%)
Industry diversity
Most Common Industries - Agriculture, forestry, fishing and hunting, and mining (%)
Most Common Industries - Agriculture, forestry, fishing and hunting (%)
Most Common Industries - Mining, quarrying, and oil and gas extraction (%)
Most Common Industries - Construction (%)
Most Common Industries - Manufacturing (%)
Most Common Industries - Wholesale trade (%)
Most Common Industries - Retail trade (%)
Most Common Industries - Transportation and warehousing, and utilities (%)
Most Common Industries - Transportation and warehousing (%)
Most Common Industries - Utilities (%)
Most Common Industries - Information (%)
Most Common Industries - Finance and insurance, and real estate and rental and leasing (%)
Most Common Industries - Finance and insurance (%)
Most Common Industries - Real estate and rental and leasing (%)
Most Common Industries - Professional, scientific, and management, and administrative and waste management services (%)
Most Common Industries - Professional, scientific, and technical services (%)
Most Common Industries - Management of companies and enterprises (%)
Most Common Industries - Administrative and support and waste management services (%)
Most Common Industries - Educational services, and health care and social assistance (%)
Most Common Industries - Educational services (%)
Most Common Industries - Health care and social assistance (%)
Most Common Industries - Arts, entertainment, and recreation, and accommodation and food services (%)
Most Common Industries - Arts, entertainment, and recreation (%)
Most Common Industries - Accommodation and food services (%)
Most Common Industries - Other services, except public administration (%)
Most Common Industries - Public administration (%)
Occupation diversity
Most Common Occupations - Management, business, science, and arts occupations (%)
Most Common Occupations - Management, business, and financial occupations (%)
Most Common Occupations - Management occupations (%)
Most Common Occupations - Business and financial operations occupations (%)
Most Common Occupations - Computer, engineering, and science occupations (%)
Most Common Occupations - Computer and mathematical occupations (%)
Most Common Occupations - Architecture and engineering occupations (%)
Most Common Occupations - Life, physical, and social science occupations (%)
Most Common Occupations - Education, legal, community service, arts, and media occupations (%)
Most Common Occupations - Community and social service occupations (%)
Most Common Occupations - Legal occupations (%)
Most Common Occupations - Education, training, and library occupations (%)
Most Common Occupations - Arts, design, entertainment, sports, and media occupations (%)
Most Common Occupations - Healthcare practitioners and technical occupations (%)
Most Common Occupations - Health diagnosing and treating practitioners and other technical occupations (%)
Most Common Occupations - Health technologists and technicians (%)
Most Common Occupations - Service occupations (%)
Most Common Occupations - Healthcare support occupations (%)
Most Common Occupations - Protective service occupations (%)
Most Common Occupations - Fire fighting and prevention, and other protective service workers including supervisors (%)
Most Common Occupations - Law enforcement workers including supervisors (%)
Most Common Occupations - Food preparation and serving related occupations (%)
Most Common Occupations - Building and grounds cleaning and maintenance occupations (%)
Most Common Occupations - Personal care and service occupations (%)
Most Common Occupations - Sales and office occupations (%)
Most Common Occupations - Sales and related occupations (%)
Most Common Occupations - Office and administrative support occupations (%)
Most Common Occupations - Natural resources, construction, and maintenance occupations (%)
Most Common Occupations - Farming, fishing, and forestry occupations (%)
Most Common Occupations - Construction and extraction occupations (%)
Most Common Occupations - Installation, maintenance, and repair occupations (%)
Most Common Occupations - Production, transportation, and material moving occupations (%)
Most Common Occupations - Production occupations (%)
Most Common Occupations - Transportation occupations (%)
Most Common Occupations - Material moving occupations (%)
People in Group quarters - Institutionalized population (%)
People in Group quarters - Correctional institutions (%)
People in Group quarters - Federal prisons and detention centers (%)
People in Group quarters - Halfway houses (%)
People in Group quarters - Local jails and other confinement facilities (including police lockups) (%)
People in Group quarters - Military disciplinary barracks (%)
People in Group quarters - State prisons (%)
People in Group quarters - Other types of correctional institutions (%)
People in Group quarters - Nursing homes (%)
People in Group quarters - Hospitals/wards, hospices, and schools for the handicapped (%)
People in Group quarters - Hospitals/wards and hospices for chronically ill (%)
People in Group quarters - Hospices or homes for chronically ill (%)
People in Group quarters - Military hospitals or wards for chronically ill (%)
People in Group quarters - Other hospitals or wards for chronically ill (%)
People in Group quarters - Hospitals or wards for drug/alcohol abuse (%)
People in Group quarters - Mental (Psychiatric) hospitals or wards (%)
People in Group quarters - Schools, hospitals, or wards for the mentally retarded (%)
People in Group quarters - Schools, hospitals, or wards for the physically handicapped (%)
People in Group quarters - Institutions for the deaf (%)
People in Group quarters - Institutions for the blind (%)
People in Group quarters - Orthopedic wards and institutions for the physically handicapped (%)
People in Group quarters - Wards in general hospitals for patients who have no usual home elsewhere (%)
People in Group quarters - Wards in military hospitals for patients who have no usual home elsewhere (%)
People in Group quarters - Juvenile institutions (%)
People in Group quarters - Long-term care (%)
People in Group quarters - Homes for abused, dependent, and neglected children (%)
People in Group quarters - Residential treatment centers for emotionally disturbed children (%)
People in Group quarters - Training schools for juvenile delinquents (%)
People in Group quarters - Short-term care, detention or diagnostic centers for delinquent children (%)
People in Group quarters - Type of juvenile institution unknown (%)
People in Group quarters - Noninstitutionalized population (%)
People in Group quarters - College dormitories (includes college quarters off campus) (%)
People in Group quarters - Military quarters (%)
People in Group quarters - On base (%)
People in Group quarters - Barracks, unaccompanied personnel housing (UPH), (Enlisted/Officer), ;and similar group living quarters for military personnel (%)
People in Group quarters - Transient quarters for temporary residents (%)
People in Group quarters - Military ships (%)
People in Group quarters - Group homes (%)
People in Group quarters - Homes or halfway houses for drug/alcohol abuse (%)
People in Group quarters - Homes for the mentally ill (%)
People in Group quarters - Homes for the mentally retarded (%)
People in Group quarters - Homes for the physically handicapped (%)
People in Group quarters - Other group homes (%)
People in Group quarters - Religious group quarters (%)
People in Group quarters - Dormitories (%)
People in Group quarters - Agriculture workers' dormitories on farms (%)
People in Group quarters - Job Corps and vocational training facilities (%)
People in Group quarters - Other workers' dormitories (%)
People in Group quarters - Crews of maritime vessels (%)
People in Group quarters - Other nonhousehold living situations (%)
People in Group quarters - Other noninstitutional group quarters (%)
Residents speaking English at home (%)
Residents speaking English at home - Born in the United States (%)
Residents speaking English at home - Native, born elsewhere (%)
Residents speaking English at home - Foreign born (%)
Residents speaking Spanish at home (%)
Residents speaking Spanish at home - Born in the United States (%)
Residents speaking Spanish at home - Native, born elsewhere (%)
Residents speaking Spanish at home - Foreign born (%)
Residents speaking other language at home (%)
Residents speaking other language at home - Born in the United States (%)
Residents speaking other language at home - Native, born elsewhere (%)
Residents speaking other language at home - Foreign born (%)
Class of Workers - Employee of private company (%)
Class of Workers - Self-employed in own incorporated business (%)
Class of Workers - Private not-for-profit wage and salary workers (%)
Class of Workers - Local government workers (%)
Class of Workers - State government workers (%)
Class of Workers - Federal government workers (%)
Class of Workers - Self-employed workers in own not incorporated business and Unpaid family workers (%)
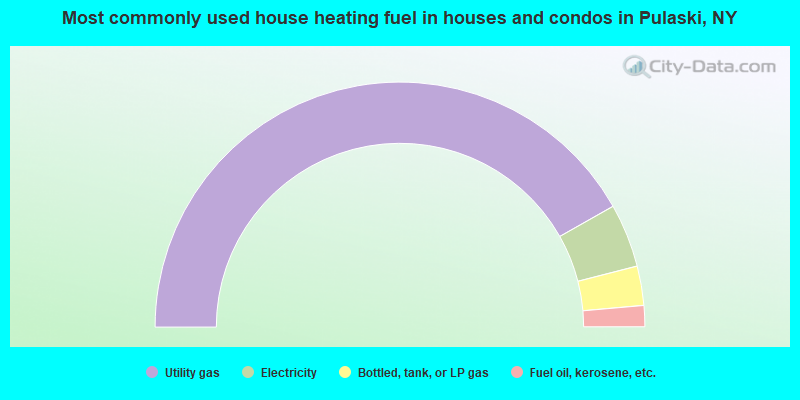
House heating fuel used in houses and condos - Utility gas (%)
House heating fuel used in houses and condos - Bottled, tank, or LP gas (%)
House heating fuel used in houses and condos - Electricity (%)
House heating fuel used in houses and condos - Fuel oil, kerosene, etc. (%)
House heating fuel used in houses and condos - Coal or coke (%)
House heating fuel used in houses and condos - Wood (%)
House heating fuel used in houses and condos - Solar energy (%)
House heating fuel used in houses and condos - Other fuel (%)
House heating fuel used in houses and condos - No fuel used (%)
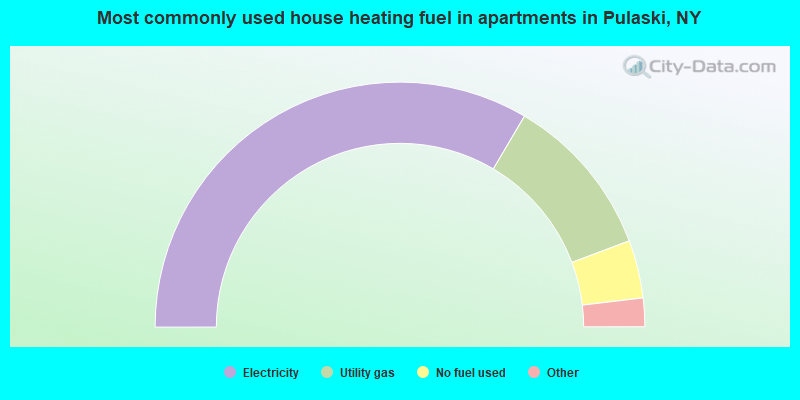
House heating fuel used in apartments - Utility gas (%)
House heating fuel used in apartments - Bottled, tank, or LP gas (%)
House heating fuel used in apartments - Electricity (%)
House heating fuel used in apartments - Fuel oil, kerosene, etc. (%)
House heating fuel used in apartments - Coal or coke (%)
House heating fuel used in apartments - Wood (%)
House heating fuel used in apartments - Solar energy (%)
House heating fuel used in apartments - Other fuel (%)
House heating fuel used in apartments - No fuel used (%)
Armed forces status - In Armed Forces (%)
Armed forces status - Civilian (%)
Armed forces status - Civilian - Veteran (%)
Armed forces status - Civilian - Nonveteran (%)
Fatal accidents locations in years 2005-2021
Fatal accidents locations in 2005
Fatal accidents locations in 2006
Fatal accidents locations in 2007
Fatal accidents locations in 2008
Fatal accidents locations in 2009
Fatal accidents locations in 2010
Fatal accidents locations in 2011
Fatal accidents locations in 2012
Fatal accidents locations in 2013
Fatal accidents locations in 2014
Fatal accidents locations in 2015
Fatal accidents locations in 2016
Fatal accidents locations in 2017
Fatal accidents locations in 2018
Fatal accidents locations in 2019
Fatal accidents locations in 2020
Fatal accidents locations in 2021
Alcohol use - People drinking some alcohol every month (%)
Alcohol use - People not drinking at all (%)
Alcohol use - Average days/month drinking alcohol
Alcohol use - Average drinks/week
Alcohol use - Average days/year people drink much
Audiometry - Average condition of hearing (%)
Audiometry - People that can hear a whisper from across a quiet room (%)
Audiometry - People that can hear normal voice from across a quiet room (%)
Audiometry - Ears ringing, roaring, buzzing (%)
Audiometry - Had a job exposure to loud noise (%)
Audiometry - Had off-work exposure to loud noise (%)
Blood Pressure & Cholesterol - Has high blood pressure (%)
Blood Pressure & Cholesterol - Checking blood pressure at home (%)
Blood Pressure & Cholesterol - Frequently checking blood cholesterol (%)
Blood Pressure & Cholesterol - Has high cholesterol level (%)
Consumer Behavior - Money monthly spent on food at supermarket/grocery store
Consumer Behavior - Money monthly spent on food at other stores
Consumer Behavior - Money monthly spent on eating out
Consumer Behavior - Money monthly spent on carryout/delivered foods
Consumer Behavior - Income spent on food at supermarket/grocery store (%)
Consumer Behavior - Income spent on food at other stores (%)
Consumer Behavior - Income spent on eating out (%)
Consumer Behavior - Income spent on carryout/delivered foods (%)
Current Health Status - General health condition (%)
Current Health Status - Blood donors (%)
Current Health Status - Has blood ever tested for HIV virus (%)
Current Health Status - Left-handed people (%)
Dermatology - People using sunscreen (%)
Diabetes - Diabetics (%)
Diabetes - Had a blood test for high blood sugar (%)
Diabetes - People taking insulin (%)
Diet Behavior & Nutrition - Diet health (%)
Diet Behavior & Nutrition - Milk product consumption (# of products/month)
Diet Behavior & Nutrition - Meals not home prepared (#/week)
Diet Behavior & Nutrition - Meals from fast food or pizza place (#/week)
Diet Behavior & Nutrition - Ready-to-eat foods (#/month)
Diet Behavior & Nutrition - Frozen meals/pizza (#/month)
Drug Use - People that ever used marijuana or hashish (%)
Drug Use - Ever used hard drugs (%)
Drug Use - Ever used any form of cocaine (%)
Drug Use - Ever used heroin (%)
Drug Use - Ever used methamphetamine (%)
Health Insurance - People covered by health insurance (%)
Kidney Conditions-Urology - Avg. # of times urinating at night
Medical Conditions - People with asthma (%)
Medical Conditions - People with anemia (%)
Medical Conditions - People with psoriasis (%)
Medical Conditions - People with overweight (%)
Medical Conditions - Elderly people having difficulties in thinking or remembering (%)
Medical Conditions - People who ever received blood transfusion (%)
Medical Conditions - People having trouble seeing even with glass/contacts (%)
Medical Conditions - People with arthritis (%)
Medical Conditions - People with gout (%)
Medical Conditions - People with congestive heart failure (%)
Medical Conditions - People with coronary heart disease (%)
Medical Conditions - People with angina pectoris (%)
Medical Conditions - People who ever had heart attack (%)
Medical Conditions - People who ever had stroke (%)
Medical Conditions - People with emphysema (%)
Medical Conditions - People with thyroid problem (%)
Medical Conditions - People with chronic bronchitis (%)
Medical Conditions - People with any liver condition (%)
Medical Conditions - People who ever had cancer or malignancy (%)
Mental Health - People who have little interest in doing things (%)
Mental Health - People feeling down, depressed, or hopeless (%)
Mental Health - People who have trouble sleeping or sleeping too much (%)
Mental Health - People feeling tired or having little energy (%)
Mental Health - People with poor appetite or overeating (%)
Mental Health - People feeling bad about themself (%)
Mental Health - People who have trouble concentrating on things (%)
Mental Health - People moving or speaking slowly or too fast (%)
Mental Health - People having thoughts they would be better off dead (%)
Oral Health - Average years since last visit a dentist
Oral Health - People embarrassed because of mouth (%)
Oral Health - People with gum disease (%)
Oral Health - General health of teeth and gums (%)
Oral Health - Average days a week using dental floss/device
Oral Health - Average days a week using mouthwash for dental problem
Oral Health - Average number of teeth
Pesticide Use - Households using pesticides to control insects (%)
Pesticide Use - Households using pesticides to kill weeds (%)
Physical Activity - People doing vigorous-intensity work activities (%)
Physical Activity - People doing moderate-intensity work activities (%)
Physical Activity - People walking or bicycling (%)
Physical Activity - People doing vigorous-intensity recreational activities (%)
Physical Activity - People doing moderate-intensity recreational activities (%)
Physical Activity - Average hours a day doing sedentary activities
Physical Activity - Average hours a day watching TV or videos
Physical Activity - Average hours a day using computer
Physical Functioning - People having limitations keeping them from working (%)
Physical Functioning - People limited in amount of work they can do (%)
Physical Functioning - People that need special equipment to walk (%)
Physical Functioning - People experiencing confusion/memory problems (%)
Physical Functioning - People requiring special healthcare equipment (%)
Prescription Medications - Average number of prescription medicines taking
Preventive Aspirin Use - Adults 40+ taking low-dose aspirin (%)
Reproductive Health - Vaginal deliveries (%)
Reproductive Health - Cesarean deliveries (%)
Reproductive Health - Deliveries resulted in a live birth (%)
Reproductive Health - Pregnancies resulted in a delivery (%)
Reproductive Health - Women breastfeeding newborns (%)
Reproductive Health - Women that had a hysterectomy (%)
Reproductive Health - Women that had both ovaries removed (%)
Reproductive Health - Women that have ever taken birth control pills (%)
Reproductive Health - Women taking birth control pills (%)
Reproductive Health - Women that have ever used Depo-Provera or injectables (%)
Reproductive Health - Women that have ever used female hormones (%)
Sexual Behavior - People 18+ that ever had sex (vaginal, anal, or oral) (%)
Sexual Behavior - Males 18+ that ever had vaginal sex with a woman (%)
Sexual Behavior - Males 18+ that ever performed oral sex on a woman (%)
Sexual Behavior - Males 18+ that ever had anal sex with a woman (%)
Sexual Behavior - Males 18+ that ever had any sex with a man (%)
Sexual Behavior - Females 18+ that ever had vaginal sex with a man (%)
Sexual Behavior - Females 18+ that ever performed oral sex on a man (%)
Sexual Behavior - Females 18+ that ever had anal sex with a man (%)
Sexual Behavior - Females 18+ that ever had any kind of sex with a woman (%)
Sexual Behavior - Average age people first had sex
Sexual Behavior - Average number of female sex partners in lifetime (males 18+)
Sexual Behavior - Average number of female vaginal sex partners in lifetime (males 18+)
Sexual Behavior - Average age people first performed oral sex on a woman (18+)
Sexual Behavior - Average number of woman performed oral sex on in lifetime (18+)
Sexual Behavior - Average number of male sex partners in lifetime (males 18+)
Sexual Behavior - Average number of male anal sex partners in lifetime (males 18+)
Sexual Behavior - Average age people first performed oral sex on a man (18+)
Sexual Behavior - Average number of male oral sex partners in lifetime (18+)
Sexual Behavior - People using protection when performing oral sex (%)
Sexual Behavior - Average number of times people have vaginal or anal sex a year
Sexual Behavior - People having sex without condom (%)
Sexual Behavior - Average number of male sex partners in lifetime (females 18+)
Sexual Behavior - Average number of male vaginal sex partners in lifetime (females 18+)
Sexual Behavior - Average number of female sex partners in lifetime (females 18+)
Sexual Behavior - Circumcised males 18+ (%)
Sleep Disorders - Average hours sleeping at night
Sleep Disorders - People that has trouble sleeping (%)
Smoking-Cigarette Use - People smoking cigarettes (%)
Taste & Smell - People 40+ having problems with smell (%)
Taste & Smell - People 40+ having problems with taste (%)
Taste & Smell - People 40+ that ever had wisdom teeth removed (%)
Taste & Smell - People 40+ that ever had tonsils teeth removed (%)
Taste & Smell - People 40+ that ever had a loss of consciousness because of a head injury (%)
Taste & Smell - People 40+ that ever had a broken nose or other serious injury to face or skull (%)
Taste & Smell - People 40+ that ever had two or more sinus infections (%)
Weight - Average height (inches)
Weight - Average weight (pounds)
Weight - Average BMI
Weight - People that are obese (%)
Weight - People that ever were obese (%)
Weight - People trying to lose weight (%)
Officers per 1,000 residents here:
0.45New York average:
3.28
Latest news from Pulaski, NY collected exclusively by city-data.com from local newspapers, TV, and radio stations
Ancestries: English (23.3%), Canadian (13.2%), Palestinian (10.9%), American (10.4%), Irish (8.5%), French Canadian (3.8%).
Current Local Time:
Incorporated on 04/26/1832
Land area: 3.29 square miles.
Population density: 695 people per square mile (low).
30 residents are foreign born
This village:
1.4%New York:
22.6%
Median real estate property taxes paid for housing units with mortgages in 2022: $4,523 (2.3%)Median real estate property taxes paid for housing units with no mortgage in 2022: $2,648 (2.4%)
Nearest city with pop. 50,000+: Clay, NY
Nearest city with pop. 200,000+: Rochester, NY
Nearest city with pop. 1,000,000+: Bronx, NY
Nearest cities:
Latitude: 43.57 N, Longitude: 76.13 W
Single-family new house construction building permits:
2020: 2 buildings , average cost: $150,0002019: 2 buildings , average cost: $182,0002016: 1 building , cost: $279,0002015: 1 building , cost: $131,0002011: 3 buildings , average cost: $63,5002010: 4 buildings , average cost: $63,5002009: 4 buildings , average cost: $63,5002008: 3 buildings , average cost: $63,5002005: 1 building , cost: $169,4002004: 1 building , cost: $217,4002003: 2 buildings , average cost: $115,5002002: 1 building , cost: $112,2002001: 1 building , cost: $164,0002000: 1 building , cost: $130,0001998: 1 building , cost: $107,000Unemployment in December 2023:
Population change in the 1990s: +52 (+2.2%).
Most common occupations in Pulaski, NY (%)
Both Males Females
Building and grounds cleaning and maintenance occupations (7.4%)
Other production occupations, including supervisors (5.6%)
Other sales and related occupations, including supervisors (4.0%)
Waiters and waitresses (3.8%)
Other management occupations, except farmers and farm managers (3.4%)
Cashiers (3.2%)
Preschool, kindergarten, elementary, and middle school teachers (3.0%)
Building and grounds cleaning and maintenance occupations (9.4%)
Other sales and related occupations, including supervisors (6.3%)
Other production occupations, including supervisors (6.3%)
Plant and system operators (5.2%)
Electrical equipment mechanics and other installation, maintenance, and repair workers, including supervisors (5.0%)
Other management occupations, except farmers and farm managers (4.0%)
Driver/sales workers and truck drivers (3.3%)
Waiters and waitresses (8.0%)
Cashiers (5.4%)
Preschool, kindergarten, elementary, and middle school teachers (5.2%)
Building and grounds cleaning and maintenance occupations (5.2%)
Other production occupations, including supervisors (4.9%)
Legal support workers (4.7%)
Customer service representatives (4.2%)
Earthquake activity:
Pulaski-area historical earthquake activity is significantly above New York state average. It is 69% smaller than the overall U.S. average. On 10/7/1983 at 10:18:46, a magnitude 5.3 (5.1 MB, 5.3 LG, 5.1 ML, Class: Moderate, Intensity: VI - VII) earthquake occurred 93.0 miles away from the city center On 4/20/2002 at 10:50:47, a magnitude 5.3 (5.3 ML, Depth: 3.0 mi) earthquake occurred 137.3 miles away from Pulaski center On 4/20/2002 at 10:50:47, a magnitude 5.2 (5.2 MB, 4.2 MS, 5.2 MW, 5.0 MW) earthquake occurred 135.6 miles away from the city center On 9/25/1998 at 19:52:52, a magnitude 5.2 (4.8 MB, 4.3 MS, 5.2 LG, 4.5 MW, Depth: 3.1 mi) earthquake occurred 260.7 miles away from the city center On 8/23/2011 at 17:51:04, a magnitude 5.8 (5.8 MW, Depth: 3.7 mi) earthquake occurred 402.5 miles away from the city center On 6/17/1991 at 08:53:16, a magnitude 4.1 (4.0 MB, 4.0 LG, Depth: 3.1 mi, Class: Light, Intensity: IV - V) earthquake occurred 97.6 miles away from the city center Magnitude types: regional Lg-wave magnitude (LG), body-wave magnitude (MB), local magnitude (ML), surface-wave magnitude (MS), moment magnitude (MW) Natural disasters: The number of natural disasters in Oswego County (16) is near the US average (15).Major Disasters (Presidential) Declared: 7Emergencies Declared: 7Floods: 6, Storms: 3, Hurricanes: 2, Snows: 2, Winds: 2, Blizzard: 1, Heavy Rain: 1, Ice Storm: 1, Landslide: 1, Power Outage: 1, Tropical Storm: 1, Other: 2 (Note: some incidents may be assigned to more than one category). Heliports located in Pulaski: Operable nuclear power plants near Pulaski:
17 miles: James A. FitzPatrick in Scriba, NY.17 miles: Nine Mile Point 1 and 2 in Scriba, NY.
Colleges/universities with over 2000 students nearest to Pulaski:
SUNY College at Oswego (about 23 miles; Oswego, NY ; Full-time enrollment: 7,550)
Jefferson Community College (about 31 miles; Watertown, NY ; FT enrollment: 2,886)
Le Moyne College (about 36 miles; Syracuse, NY ; FT enrollment: 3,041)
Syracuse University (about 37 miles; Syracuse, NY ; FT enrollment: 20,717)
SUNY College of Environmental Science and Forestry (about 37 miles; Syracuse, NY ; FT enrollment: 2,044)
Onondaga Community College (about 39 miles; Syracuse, NY ; FT enrollment: 8,920)
Cayuga County Community College (about 48 miles; Auburn, NY ; FT enrollment: 3,141)
Public high school in Pulaski:
Public elementary/middle schools in Pulaski: PULASKI ELEMENTARY SCHOOL Students: 563, Location: 2 HINMAN RD, Grades: PK-5)PULASKI MIDDLE SCHOOL Location: 4624 SALINA ST, Grades: 6-8)
Private elementary/middle school in Pulaski:
See full list of schools located in Pulaski Library in Pulaski: PULASKI PUBLIC LIBRARY Operating income: $121,176; Location: 4917 NORTH JEFFERSON STREET; 26,892 books ; 929 audio materials ; 1,295 video materials ; 14 state licensed databases ; 6 other licensed databases ; 28 print serial subscriptions )
User-submitted facts and corrections:
Health Care Centers are in Pulaski & nearby in Parish & Central Square. The Pulaski Health Center accepts walk-in patients & is open 6 days a week, Monday through Saturday.
Notable locations in Pulaski: (A) , Kallet Theatre (B) , Pulaski Municipal Building (C) , Randall House (D) , Ringgold Fire Company 1 (E) , Pulaski Fire Department (F) , Pulaski Public Library (G) , Adirondack Manor Assisted Living Facility (H) . Display/hide their locations on the map
Churches in Pulaski include: (A) , Saint John's Roman Catholic Church (B) , Saint James Episcopal Church (C) , First Congregational Church (D) , First Methodist Church (E) , The Church of Jesus Christ of Latter Day Saints (F) . Display/hide their locations on the map
Cemetery: (1) . Display/hide its location on the map
Lake: (A) . Display/hide its location on the map
Streams, rivers, and creeks: (A) . Display/hide its location on the map
Tourist attraction:
Hotels:
Oswego County has a predicted average indoor radon screening level between 2 and 4 pCi/L (pico curies per liter) - Moderate Potential Drinking water stations with addresses in Pulaski and their reported violations in the past:
ONTARIO SHORES RV PARK, INC (Population served: 440, Groundwater):
Past monitoring violations:
5 routine major monitoring violations
One regular monitoring violation
Address: 186 SOUTH RAINBOW SHORES ROAD Population served: 322, Groundwater):
Past monitoring violations:
5 routine major monitoring violations
2 regular monitoring violations
Population served: 150, Groundwater under infl of surface water):
Past health violations:
MCL, Average - Between OCT-2012 and DEC-2012, Contaminant: Nitrate. Follow-up actions: St Public Notif requested (OCT-24-2012), St Compliance achieved (OCT-24-2012), St Formal NOV issued (OCT-24-2012)
MCL, Average - Between JAN-2011 and DEC-2011, Contaminant: Nitrate. Follow-up actions: St Public Notif requested (FEB-03-2012), St Compliance achieved (FEB-03-2012), St Formal NOV issued (FEB-03-2012)
Failure to Filter (SWTR) - In APR-01-2009. Follow-up actions: St Public Notif requested (APR-01-2009), St Formal NOV issued (APR-01-2009), St BCA signed (JUN-05-2009)
MCL, Acute (TCR) - Between APR-2008 and JUN-2008, Contaminant: Coliform. Follow-up actions: St Boil Water Order (JUN-23-2008), St Public Notif requested (JUL-08-2008), St Formal NOV issued (JUL-08-2008), St Compliance achieved (JUL-22-2008)
Past monitoring violations:
8 routine major monitoring violations
One regular monitoring violation
Population served: 74, Groundwater under infl of surface water):
Past health violations:
Failure to Filter (SWTR) - In JUL-01-2011. Follow-up actions: St BCA signed (AUG-01-2011)
Past monitoring violations:
6 routine major monitoring violations
One regular monitoring violation
Population served: 67, Groundwater under infl of surface water):
Past health violations:
MCL, Monthly (TCR) - In OCT-2012, Contaminant: Coliform. Follow-up actions: St Formal NOV issued (NOV-05-2012), St Compliance achieved (NOV-05-2012), St Boil Water Order (NOV-05-2012)
MCL, Monthly (TCR) - In JUL-2011, Contaminant: Coliform. Follow-up actions: St Formal NOV issued (JUL-25-2011), St Public Notif requested (JUL-25-2011), St Compliance achieved (JUL-25-2011), St Boil Water Order (JUL-25-2011)
MCL, Monthly (TCR) - Between APR-2011 and JUN-2011, Contaminant: Coliform. Follow-up actions: St Formal NOV issued (MAY-12-2011), St Public Notif requested (MAY-12-2011), St Compliance achieved (MAY-12-2011), St Boil Water Order (MAY-12-2011)
MCL, Monthly (TCR) - In AUG-2010, Contaminant: Coliform. Follow-up actions: St Formal NOV issued (SEP-01-2010), St Boil Water Order (SEP-01-2010), St Public Notif requested (SEP-01-2010), St Compliance achieved (SEP-10-2010)
MCL, Monthly (TCR) - Between OCT-2009 and DEC-2009, Contaminant: Coliform. Follow-up actions: St Boil Water Order (OCT-22-2009), St Formal NOV issued (OCT-22-2009), St Public Notif requested (OCT-22-2009), St Tech Assistance Visit (2 times from OCT-26-2009 to OCT-27-2009), St Compliance achieved (OCT-29-2009), St Public Notif received (NOV-04-2009)
Failure to Filter (SWTR) - In APR-01-2009. Follow-up actions: St Public Notif requested (APR-01-2009), St Formal NOV issued (APR-01-2009), St BCA signed (APR-08-2009), St Public Notif received (APR-21-2009)
MCL, Monthly (TCR) - Between OCT-2008 and DEC-2008, Contaminant: Coliform. Follow-up actions: St Boil Water Order (DEC-29-2008), St Formal NOV issued (DEC-29-2008), St Public Notif requested (DEC-29-2008), St Tech Assistance Visit (2 times from JAN-05-2009 to JAN-06-2009), St Compliance achieved (JAN-07-2009), St Public Notif received (MAR-24-2009)
Past monitoring violations:
15 routine major monitoring violations
One regular monitoring violation
Population served: 50, Groundwater):
Past monitoring violations:
One routine major monitoring violation
Population served: 40, Groundwater):
Past health violations:
MCL, Monthly (TCR) - Between APR-2013 and JUN-2013, Contaminant: Coliform. Follow-up actions: St Formal NOV issued (APR-22-2013), St Compliance achieved (APR-22-2013), St Boil Water Order (APR-22-2013)
Past monitoring violations:
One routine major monitoring violation
Population served: 25, Groundwater under infl of surface water):
Past health violations:
Failure to Filter (SWTR) - In APR-01-2009. Follow-up actions: St Public Notif requested (APR-01-2009), St Formal NOV issued (APR-01-2009), St BCA signed (APR-09-2009), St Public Notif received (APR-23-2009)
Past monitoring violations:
5 routine major monitoring violations
Average household size: This village:
2.2 peopleNew York:
2.6 people
Percentage of family households: This village:
53.2%Whole state:
63.5%
Percentage of households with unmarried partners: This village:
11.5%Whole state:
6.8%
Likely homosexual households (counted as self-reported same-sex unmarried-partner households)
Lesbian couples: 0.1% of all households Gay men: 0.1% of all households
4 people in group homes intended for adults in 2010people in other noninstitutional group quarters in 2000
Banks with branches in Pulaski (2011 data):
Community Bank, National Association: Pulaski Branch at 4854 North Jefferson Street, branch established on 1934/10/01. Info updated 2011/06/13: Bank assets: $6,460.6 mil, Deposits: $4,840.4 mil, headquarters in Canton, NY, positive income , 175 total offices , Holding Company: Community Bank System, Inc.
Alliance Bank, National Association: Pulaski Branch at 7577-79 Jefferson Street, branch established on 1967/06/19. Info updated 2006/10/25: Bank assets: $1,403.5 mil, Deposits: $1,088.5 mil, headquarters in Syracuse, NY, positive income , 28 total offices , Holding Company: Alliance Financial Corporation
KeyBank National Association: Pulaski Branch at 4763 Salina Street, branch established on 1983/12/05. Info updated 2008/03/03: Bank assets: $86,198.8 mil, Deposits: $64,214.8 mil, headquarters in Cleveland, OH, positive income , Commercial Lending Specialization, 1067 total offices , Holding Company: Keycorp
For population 15 years and over in Pulaski:
Never married: 32.3%Now married: 45.7%Separated: 2.6%Widowed: 7.6%Divorced: 11.8% For population 25 years and over in Pulaski:
High school or higher: 89.5%Bachelor's degree or higher: 24.1%Graduate or professional degree: 10.5%Unemployed: 12.3%Mean travel time to work (commute): 30.2 minutes
Education Gini index (Inequality in education) Here:
11.0New York average:
13.9
Religion statistics for Pulaski, NY (based on Oswego County data)
Religion Adherents Congregations Catholic 25,395 17 Mainline Protestant 10,408 60 Evangelical Protestant 5,504 53 Other 860 6 None 79,942 -
Source: Clifford Grammich, Kirk Hadaway, Richard Houseal, Dale E.Jones, Alexei Krindatch, Richie Stanley and Richard H.Taylor. 2012. 2010 U.S.Religion Census: Religious Congregations & Membership Study. Association of Statisticians of American Religious Bodies. Jones, Dale E., et al. 2002. Congregations and Membership in the United States 2000. Nashville, TN: Glenmary Research Center. Graphs represent county-level data
Food Environment Statistics: Number of grocery stores : 25Oswego County :
2.06 / 10,000 pop.State :
4.13 / 10,000 pop.
Number of supercenters and club stores : 1Oswego County :
0.08 / 10,000 pop.State :
0.06 / 10,000 pop.
Number of convenience stores (no gas) : 6This county :
0.49 / 10,000 pop.State :
0.92 / 10,000 pop.
Number of convenience stores (with gas) : 49Here :
4.03 / 10,000 pop.New York :
1.68 / 10,000 pop.
Number of full-service restaurants : 86Here :
7.08 / 10,000 pop.State :
8.82 / 10,000 pop.
Adult diabetes rate : This county :
8.5%New York :
8.2%
Adult obesity rate : Oswego County :
27.7%State :
23.8%
Low-income preschool obesity rate : This county :
14.8%New York :
15.6%
Health and Nutrition: Healthy diet rate : Pulaski:
51.7%New York:
50.1%
Average overall health of teeth and gums : People feeling badly about themselves : Pulaski:
18.7%New York:
20.3%
People not drinking alcohol at all : Pulaski:
10.2%New York:
11.1%
Average hours sleeping at night : Overweight people : Pulaski:
32.7%New York:
33.4%
General health condition : Pulaski:
57.1%New York:
56.5%
Average condition of hearing : Pulaski:
77.7%New York:
80.2%
More about Health and Nutrition of Pulaski, NY Residents
Local government employment and payroll (March 2022)
Function
Full-time employees
Monthly full-time payroll
Average yearly full-time wage
Part-time employees
Monthly part-time payroll
Other and Unallocable
4 $2,657 $7,971 0 $0 Financial Administration
3 $9,928 $39,712 0 $0 Local Libraries
2 $2,436 $14,616 1 $1,395 Streets and Highways
0 $0 7 $2,657 Other Government Administration
0 $0 6 $3,799 Police Protection - Officers
0 $0 8 $10,522 Judicial and Legal
0 $0 1 $127
Totals for Government
9 $15,021 $20,028 23 $18,501
Pulaski government finances - Expenditure in 2017 (per resident):
Construction - Parks and Recreation: $24,000 ($10.50)
Current Operations - Sewerage: $417,000 ($182.41)
Regular Highways: $214,000 ($93.61)Water Utilities: $192,000 ($83.99)General - Other: $164,000 ($71.74)Police Protection: $136,000 ($59.49)Libraries: $118,000 ($51.62)Financial Administration: $58,000 ($25.37)General Public Buildings: $54,000 ($23.62)Solid Waste Management: $51,000 ($22.31)Miscellaneous Commercial Activities - Other: $30,000 ($13.12)Protective Inspection and Regulation - Other: $29,000 ($12.69)Parks and Recreation: $21,000 ($9.19)Central Staff Services: $16,000 ($7.00)Judicial and Legal Services: $12,000 ($5.25)General - Interest on Debt: $119,000 ($52.06)
Other Capital Outlay - Regular Highways: $82,000 ($35.87)
Police Protection: $29,000 ($12.69)Water Utilities: $10,000 ($4.37)Sewerage: $9,000 ($3.94)Financial Administration: $6,000 ($2.62)Miscellaneous Commercial Activities - Other: $6,000 ($2.62)Parks and Recreation: $4,000 ($1.75)Libraries: $3,000 ($1.31)Total Salaries and Wages: $594,000 ($259.84)
Pulaski government finances - Revenue in 2017 (per resident):
Charges - Sewerage: $634,000 ($277.34)
Solid Waste Management: $38,000 ($16.62)Miscellaneous Commercial Activities: $20,000 ($8.75)Other: $9,000 ($3.94)Local Intergovernmental - General Local Government Support: $113,000 ($49.43)
Other: $91,000 ($39.81)Miscellaneous - General Revenue - Other: $60,000 ($26.25)
Rents: $24,000 ($10.50)Interest Earnings: $3,000 ($1.31)Donations From Private Sources: $1,000 ($0.44)Revenue - Water Utilities: $435,000 ($190.29)
State Intergovernmental - Highways: $42,000 ($18.37)
General Local Government Support: $17,000 ($7.44)Other: $11,000 ($4.81)Tax - Property: $606,000 ($265.09)
Public Utilities Sales: $65,000 ($28.43)Other License: $20,000 ($8.75)Amusements License: $1,000 ($0.44)
Pulaski government finances - Debt in 2017 (per resident):
Long Term Debt - Beginning Outstanding - Unspecified Public Purpose: $4,481,000 ($1960.19)
Outstanding Unspecified Public Purpose: $4,314,000 ($1887.14)Retired Unspecified Public Purpose: $303,000 ($132.55)Issue, Unspecified Public Purpose: $136,000 ($59.49)Short Term Debt Outstanding - Beginning: $143,000 ($62.55)
Pulaski government finances - Cash and Securities in 2017 (per resident):
Bond Funds - Cash and Securities: $102,000 ($44.62)
Other Funds - Cash and Securities: $1,483,000 ($648.73)
Businesses in Pulaski, NY
Name Count Name Count
ALDI 1 MasterBrand Cabinets 3 Ace Hardware 1 McDonald's 1 Advance Auto Parts 1 Rite Aid 1 Arby's 1 Subway 1 Burger King 1 Super 8 1 Chevrolet 1 Tim Hortons 1 Dunkin Donuts 1 Travelodge 1 Ford 1 U-Haul 1 GNC 1 UPS 1 H&R Block 1
Strongest AM radio stations in Pulaski:
WSCP (1070 AM; daytime; 2 kW; SANDY CREEK-PULASKI, NY; Owner: GALAXY COMMUNICATIONS, L.P.)
WHEN (620 AM; 5 kW; SYRACUSE, NY; Owner: CLEAR CHANNEL BROADCASTING LICENSES, INC.)
WHAM (1180 AM; 50 kW; ROCHESTER, NY; Owner: CITICASTERS LICENSES, L.P.)
WSYR (570 AM; 5 kW; SYRACUSE, NY; Owner: CLEAR CHANNEL BROADCASTING LICENSES, INC.)
WDCW (1390 AM; 5 kW; SYRACUSE, NY; Owner: KIMTRON, INC.)
WGY (810 AM; 50 kW; SCHENECTADY, NY; Owner: CLEAR CHANNEL BROADCASTING LICENSES, INC.)
WNER (1410 AM; 5 kW; WATERTOWN, NY)
WFBL (1050 AM; 2 kW; BALDWINSVILLE, NY; Owner: BUCKLEY BROADCASTING CORPORATION)
WNSS (1260 AM; 5 kW; SYRACUSE, NY; Owner: CITADEL BROADCASTING COMPANY)
WPTR (1540 AM; 50 kW; ALBANY, NY; Owner: KIMTRON, INC.)
WIBX (950 AM; 5 kW; UTICA, NY; Owner: REGENT LICENSEE OF UTICA/ROME, INC.)
WRUN (1150 AM; 5 kW; UTICA, NY)
WICY (1490 AM; 50 kW; MALONE, NY; Owner: CARTIER COMMUNICATIONS INC.)
Strongest FM radio stations in Pulaski:
WSCP-FM (101.7 FM; PULASKI, NY; Owner: GALAXY COMMUNICATIONS, L.P.)
WVOA-FM (103.9 FM; MEXICO, NY; Owner: RENARD COMMUNICATIONS CORP.)
WBDI (106.7 FM; COPENHAGEN, NY; Owner: FORCE COMMUNICATIONS, INC)
WJNY (90.9 FM; WATERTOWN, NY; Owner: PUBLIC B/CNG COUNCIL CENTRAL NY, INC)
WFRY-FM (97.5 FM; WATERTOWN, NY; Owner: REGENT LICENSEE OF WATERTOWN, INC.)
WOLF-FM (96.7 FM; OSWEGO, NY; Owner: WOLF RADIO, INC.)
WTKV (105.5 FM; OSWEGO, NY; Owner: GALAXY COMMUNICATIONS, L.P.)
WOTT (100.7 FM; HENDERSON, NY; Owner: JEFFERSON BROADCASTING, INC.)
WRVO (89.9 FM; OSWEGO, NY; Owner: STATE UNIVERSITY OF NEW YORK)
WKRH (106.5 FM; MINETTO, NY; Owner: GALAXY COMMUNICATIONS, L.P.)
WBBS (104.7 FM; FULTON, NY; Owner: CITICASTERS LICENSES, L.P.)
WLLG (99.3 FM; LOWVILLE, NY; Owner: THE FLACK BROADCASTING GROUP L.L.C.)
WTOJ (103.1 FM; CARTHAGE, NY; Owner: CLANCY-MANCE COMMUNICATIONS, INC.)
TV broadcast stations around Pulaski:
WSPX-TV (Channel 56; SYRACUSE, NY; Owner: PAXSON SYRACUSE LICENSE, INC.)
WWTI (Channel 50; WATERTOWN, NY; Owner: CENTRAL NY NEWS, INC.)
WPBS-TV (Channel 16; WATERTOWN, NY; Owner: ST. LAWRENCE VALLEY EDUCATIONAL TV COUNCIL, INC)
WCNY-TV (Channel 24; SYRACUSE, NY; Owner: PUBLIC BROADCASTING COUNCIL OF CENTRAL NEW YORK)
WNYS-TV (Channel 43; SYRACUSE, NY; Owner: RKM MEDIA, INC.)
Pulaski fatal accident statistics for 1975 - 2021
Pulaski fatal accident list:
Jul 23, 2010 04:20 PM, Lake St, N Jefferson St, Lat: 43.566906, Lon: -76.127489, Vehicles: 1, Persons: 3, Pedestrians: 1, Fatalities: 1Vehicles: 2, Persons: 3, Fatalities: 1, Drunk persons involved: 1Vehicles: 2, Persons: 6, Fatalities: 2Vehicles: 1, Persons: 3, Fatalities: 1, Drunk persons involved: 1Vehicles: 1, Persons: 1, Fatalities: 1Vehicles: 1, Persons: 3, Fatalities: 1, Drunk persons involved: 1
National Bridge Inventory (NBI) Statistics 14 Number of bridges167ft / 51.2m Total length $21,983,000 Total costs97,485 Total average daily traffic7,914 Total average daily truck traffic
New bridges - historical statistics
1 1930-1939 10 1960-1969 1 1970-1979 1 1980-1989 1 2000-2009
See full National Bridge Inventory statistics for Pulaski, NY
FCC Registered Antenna Towers: 11 (
See the full list of FCC Registered Antenna Towers in Pulaski )
FCC Registered Commercial Land Mobile Towers: 1 (
See the full list of FCC Registered Commercial Land Mobile Towers in Pulaski, NY )
FCC Registered Broadcast Land Mobile Towers: 10 (
See the full list of FCC Registered Broadcast Land Mobile Towers )
FCC Registered Microwave Towers: 5
PULASKI, Niagara Mohawk Service Ctr Us Rt 11 (Lat: 43.577222 Lon: -76.120000), Type: Ltower, Structure height: 64 m, Call Sign: WNEQ384, Assigned Frequencies: 6004.50 MHz, 6063.80 MHz, 5945.20 MHz, 6063.80 MHz, 6004.50 MHz, 6123.10 MHz, 6123.10 MHz, 6152.75 MHz, 6004.50 MHz, 6034.15 MHz... (+78 more), Grant Date: 01/05/2018, Expiration Date: 02/25/2028, Certifier: Chris Kelly, Registrant: National Grid Usa Service Company Inc., 300 Erie Boulevard West, Syracuse, NY 13202, Phone: (315) 428-6372, Fax: (315) 428-6689, Email:
STATION, State Rt 11 At Niagara Mohawk Power Office Site (Lat: 43.577278 Lon: -76.119639), Overall height: 64 m, Call Sign: WNTP317, Assigned Frequencies: 928.456 MHz, 952.456 MHz, Grant Date: 04/16/2022, Expiration Date: 07/07/2032, Certifier: Chris Kelly, Registrant: Utilities Technology Council, 2550 South Clark St., Suite 960, Arlington, VA 22202, Phone: (202) 833-6818, Fax: (202) 872-1331, Email:
Studio, 5090 State Route 11 (Lat: 43.582000 Lon: -76.116861), Type: Tower, Structure height: 25.3 m, Call Sign: WQAR344, Assigned Frequencies: 948.000 MHz, Grant Date: 07/23/2004, Expiration Date: 06/01/2014, Cancellation Date: 04/14/2008, Certifier: Edward Levine, Registrant: Leventhal Senter & Lerman Pllc, 2000 K Street, N.W., Suite 600, Washington, DC 20006-1809, Phone: (202) 429-8970, Fax: (202) 293-7783, Email:
HOWARDVILLE, 1723 Rt 104 (Lat: 43.460806 Lon: -76.092528), Type: Ltower, Structure height: 60.7 m, Call Sign: WQUI252, Assigned Frequencies: 11245.0 MHz, Grant Date: 07/15/2014, Expiration Date: 07/15/2024, Certifier: Chris Harris, Registrant: Conterra Ultra Broadband, LLC, 2101 Rexford Rd, Ste 200e, Charlotte, NC 28211, Phone: (704) 936-1801, Fax: (704) 936-1801, Email:
WSCP Studio, 5090 Route 11 (Lat: 43.582000 Lon: -76.116861), Type: Tower, Structure height: 25.3 m, Call Sign: WGV790, Assigned Frequencies: 948.000 MHz, Grant Date: 09/16/1981, Expiration Date: 06/01/2030, Registrant: Leventhal Senter & Lerman Pllc, 2000 K Street, N.W., Suite 600, Washington, DC 20006-1809, Phone: (202) 429-8970, Fax: (202) 293-7783 FCC Registered Paging Towers: 1
7630 N. Jefferson Street (Lat: 43.570056 Lon: -76.122972), Overall height: 37.8 m, Call Sign: KNKP657, Assigned Frequencies: 454.600 MHz, Grant Date: 04/19/1999, Expiration Date: 04/01/2009, Cancellation Date: 10/05/2004, Registrant: Fiorio Communications Consulting, 10451 Twin Rivers Road Suite 207, Columbia, MD 27104-2333, Phone: (301) 596-1000, Fax: (301) 596-1121, Email:
FCC Registered Amateur Radio Licenses: 39 (
See the full list of FCC Registered Amateur Radio Licenses in Pulaski )
FAA Registered Aircraft: 3
Aircraft: CESSNA 172B (Category: Land, Seats: 4, Weight: Up to 12,499 Pounds, Speed: 105 mph), Engine: CONT MOTOR 0-300 SER (145 HP) (Reciprocating)N-Number: 281NY, N281NY, N-281NY, Serial Number: 17247934, Year manufactured: 1960, Airworthiness Date: 10/31/1960, Certificate Issue Date: 07/01/1983Registrant (Individual): Charles H Krupke, Po Box 315, Pulaski, NY 13142Aircraft: BEECH J35 (Category: Land, Seats: 5, Weight: Up to 12,499 Pounds, Speed: 150 mph), Engine: CONT MOTOR I0-470 SERIES (260 HP) (Reciprocating)N-Number: 3032C, N3032C, N-3032C, Serial Number: D-5687, Airworthiness Date: 09/05/1958, Certificate Issue Date: 06/29/2019Registrant (Individual): Michael J Price, 3 Clarence Ave, Pulaski, NY 13142Aircraft: CESSNA 172F (Category: Land, Seats: 4, Weight: Up to 12,499 Pounds, Speed: 105 mph), Engine: CONT MOTOR 0-300 SER (145 HP) (Reciprocating)N-Number: 5449R, N5449R, N-5449R, Serial Number: 17253002, Year manufactured: 1965, Airworthiness Date: 05/14/1965, Certificate Issue Date: 05/01/2009Registrant (Individual): Robert W Sr Hawley, 38 Albro Tract, Pulaski, NY 13142
Home Mortgage Disclosure Act Aggregated Statistics For Year 2009(Based on 1 full tract) A) FHA, FSA/RHS & VA B) Conventional C) Refinancings D) Home Improvement Loans F) Non-occupant Loans on G) Loans On Manufactured Number Average Value Number Average Value Number Average Value Number Average Value Number Average Value Number Average Value
LOANS ORIGINATED 4 $87,250 7 $126,286 16 $84,438 7 $22,286 1 $35,000 0 $0 APPLICATIONS APPROVED, NOT ACCEPTED 0 $0 1 $75,000 2 $54,500 0 $0 0 $0 0 $0 APPLICATIONS DENIED 0 $0 4 $128,500 8 $74,250 3 $8,667 0 $0 1 $36,000 APPLICATIONS WITHDRAWN 0 $0 0 $0 6 $90,000 0 $0 0 $0 0 $0 FILES CLOSED FOR INCOMPLETENESS 1 $156,000 0 $0 1 $110,000 0 $0 1 $110,000 0 $0
Aggregated Statistics For Year 2008(Based on 1 full tract) A) FHA, FSA/RHS & VA B) Conventional C) Refinancings D) Home Improvement Loans F) Non-occupant Loans on G) Loans On Manufactured Number Average Value Number Average Value Number Average Value Number Average Value Number Average Value Number Average Value
LOANS ORIGINATED 7 $87,714 8 $71,375 8 $69,875 15 $34,133 5 $47,200 0 $0 APPLICATIONS APPROVED, NOT ACCEPTED 1 $101,000 1 $51,000 3 $113,667 3 $48,333 0 $0 1 $51,000 APPLICATIONS DENIED 1 $95,000 4 $52,750 15 $85,467 11 $61,182 0 $0 2 $45,000 APPLICATIONS WITHDRAWN 2 $88,500 2 $34,500 7 $120,714 6 $74,333 0 $0 1 $5,000 FILES CLOSED FOR INCOMPLETENESS 0 $0 0 $0 1 $81,000 0 $0 0 $0 0 $0
Aggregated Statistics For Year 2007(Based on 1 full tract) A) FHA, FSA/RHS & VA B) Conventional C) Refinancings D) Home Improvement Loans E) Loans on Dwellings For 5+ Families F) Non-occupant Loans on G) Loans On Manufactured Number Average Value Number Average Value Number Average Value Number Average Value Number Average Value Number Average Value Number Average Value
LOANS ORIGINATED 3 $106,000 15 $85,000 15 $99,400 18 $26,778 0 $0 6 $62,500 1 $82,000 APPLICATIONS APPROVED, NOT ACCEPTED 0 $0 4 $66,000 4 $79,000 2 $13,500 1 $248,000 0 $0 1 $119,000 APPLICATIONS DENIED 1 $82,000 8 $70,000 26 $77,269 20 $42,400 0 $0 4 $60,750 3 $40,000 APPLICATIONS WITHDRAWN 1 $93,000 1 $20,000 15 $99,667 3 $42,667 0 $0 0 $0 0 $0 FILES CLOSED FOR INCOMPLETENESS 0 $0 0 $0 6 $100,333 0 $0 0 $0 0 $0 0 $0
Aggregated Statistics For Year 2006(Based on 1 full tract) A) FHA, FSA/RHS & VA B) Conventional C) Refinancings D) Home Improvement Loans E) Loans on Dwellings For 5+ Families F) Non-occupant Loans on G) Loans On Manufactured Number Average Value Number Average Value Number Average Value Number Average Value Number Average Value Number Average Value Number Average Value
LOANS ORIGINATED 2 $77,500 18 $74,944 27 $82,593 12 $25,167 1 $541,000 3 $105,000 1 $37,000 APPLICATIONS APPROVED, NOT ACCEPTED 0 $0 4 $167,500 3 $87,333 1 $3,000 0 $0 0 $0 1 $108,000 APPLICATIONS DENIED 2 $91,000 9 $77,778 34 $77,824 22 $33,136 0 $0 4 $59,000 2 $90,500 APPLICATIONS WITHDRAWN 2 $138,500 7 $84,571 19 $83,421 4 $31,500 0 $0 4 $97,750 1 $71,000 FILES CLOSED FOR INCOMPLETENESS 0 $0 0 $0 3 $116,667 0 $0 0 $0 0 $0 0 $0
Aggregated Statistics For Year 2005(Based on 1 full tract) A) FHA, FSA/RHS & VA B) Conventional C) Refinancings D) Home Improvement Loans F) Non-occupant Loans on G) Loans On Manufactured Number Average Value Number Average Value Number Average Value Number Average Value Number Average Value Number Average Value
LOANS ORIGINATED 8 $88,250 24 $66,292 22 $66,182 18 $12,111 12 $58,083 2 $19,500 APPLICATIONS APPROVED, NOT ACCEPTED 0 $0 5 $70,600 11 $81,727 1 $25,000 1 $158,000 0 $0 APPLICATIONS DENIED 0 $0 5 $56,400 30 $72,033 10 $21,900 2 $83,000 3 $36,000 APPLICATIONS WITHDRAWN 0 $0 3 $49,333 22 $83,409 2 $45,500 2 $65,000 1 $52,000 FILES CLOSED FOR INCOMPLETENESS 0 $0 1 $40,000 5 $86,200 0 $0 0 $0 0 $0
Aggregated Statistics For Year 2004(Based on 1 full tract) A) FHA, FSA/RHS & VA B) Conventional C) Refinancings D) Home Improvement Loans F) Non-occupant Loans on G) Loans On Manufactured Number Average Value Number Average Value Number Average Value Number Average Value Number Average Value Number Average Value
LOANS ORIGINATED 7 $74,286 19 $71,421 30 $75,167 11 $20,818 12 $45,750 2 $21,500 APPLICATIONS APPROVED, NOT ACCEPTED 1 $46,000 0 $0 12 $66,250 1 $30,000 2 $63,000 0 $0 APPLICATIONS DENIED 0 $0 9 $76,000 31 $64,419 8 $20,875 8 $51,750 2 $58,500 APPLICATIONS WITHDRAWN 1 $92,000 4 $55,250 25 $94,480 5 $20,200 2 $22,000 0 $0 FILES CLOSED FOR INCOMPLETENESS 0 $0 2 $92,500 2 $70,000 2 $35,000 3 $81,667 0 $0
Aggregated Statistics For Year 2003(Based on 1 full tract) A) FHA, FSA/RHS & VA B) Conventional C) Refinancings D) Home Improvement Loans F) Non-occupant Loans on Number Average Value Number Average Value Number Average Value Number Average Value Number Average Value
LOANS ORIGINATED 7 $60,571 20 $70,050 56 $68,946 12 $19,167 8 $47,750 APPLICATIONS APPROVED, NOT ACCEPTED 3 $85,333 2 $37,500 11 $52,091 1 $45,000 1 $35,000 APPLICATIONS DENIED 0 $0 1 $65,000 21 $79,238 9 $30,000 1 $50,000 APPLICATIONS WITHDRAWN 0 $0 5 $66,400 20 $72,750 1 $35,000 0 $0 FILES CLOSED FOR INCOMPLETENESS 0 $0 0 $0 1 $49,000 1 $15,000 0 $0
Aggregated Statistics For Year 2002(Based on 1 full tract) A) FHA, FSA/RHS & VA B) Conventional C) Refinancings D) Home Improvement Loans F) Non-occupant Loans on Number Average Value Number Average Value Number Average Value Number Average Value Number Average Value
LOANS ORIGINATED 10 $58,500 20 $70,400 25 $66,760 10 $23,000 2 $63,000 APPLICATIONS APPROVED, NOT ACCEPTED 1 $67,000 0 $0 5 $37,400 2 $3,500 1 $37,000 APPLICATIONS DENIED 0 $0 2 $45,000 13 $66,538 6 $14,833 1 $65,000 APPLICATIONS WITHDRAWN 1 $30,000 3 $72,667 21 $68,429 0 $0 0 $0 FILES CLOSED FOR INCOMPLETENESS 0 $0 0 $0 1 $15,000 0 $0 0 $0
Aggregated Statistics For Year 2001(Based on 1 full tract) A) FHA, FSA/RHS & VA B) Conventional C) Refinancings D) Home Improvement Loans E) Loans on Dwellings For 5+ Families F) Non-occupant Loans on Number Average Value Number Average Value Number Average Value Number Average Value Number Average Value Number Average Value
LOANS ORIGINATED 6 $77,500 26 $52,423 27 $68,556 6 $21,333 2 $908,500 5 $52,600 APPLICATIONS APPROVED, NOT ACCEPTED 1 $66,000 1 $28,000 8 $38,125 1 $27,000 0 $0 1 $59,000 APPLICATIONS DENIED 1 $53,000 10 $52,400 20 $52,600 11 $8,545 0 $0 3 $37,000 APPLICATIONS WITHDRAWN 0 $0 2 $90,000 25 $56,320 3 $19,000 0 $0 0 $0 FILES CLOSED FOR INCOMPLETENESS 0 $0 0 $0 1 $20,000 0 $0 0 $0 0 $0
Aggregated Statistics For Year 2000(Based on 1 full tract) A) FHA, FSA/RHS & VA B) Conventional C) Refinancings D) Home Improvement Loans F) Non-occupant Loans on Number Average Value Number Average Value Number Average Value Number Average Value Number Average Value
LOANS ORIGINATED 5 $65,200 22 $60,955 17 $42,941 14 $16,143 2 $45,500 APPLICATIONS APPROVED, NOT ACCEPTED 0 $0 8 $45,250 1 $45,000 4 $32,500 0 $0 APPLICATIONS DENIED 0 $0 37 $37,135 14 $50,786 12 $11,167 4 $31,500 APPLICATIONS WITHDRAWN 0 $0 2 $28,500 3 $55,667 1 $63,000 1 $28,000 FILES CLOSED FOR INCOMPLETENESS 0 $0 0 $0 0 $0 0 $0 0 $0
Aggregated Statistics For Year 1999(Based on 1 full tract) A) FHA, FSA/RHS & VA B) Conventional C) Refinancings D) Home Improvement Loans F) Non-occupant Loans on Number Average Value Number Average Value Number Average Value Number Average Value Number Average Value
LOANS ORIGINATED 5 $76,928 16 $50,182 25 $62,571 10 $12,261 4 $26,450 APPLICATIONS APPROVED, NOT ACCEPTED 0 $0 5 $38,564 3 $55,703 0 $0 1 $48,450 APPLICATIONS DENIED 1 $55,370 12 $49,440 14 $51,559 7 $11,160 0 $0 APPLICATIONS WITHDRAWN 1 $74,160 0 $0 15 $63,877 0 $0 1 $49,440 FILES CLOSED FOR INCOMPLETENESS 0 $0 0 $0 1 $96,900 0 $0 0 $0
Detailed HMDA statistics for the following Tracts:
0203.01
Private Mortgage Insurance Companies Aggregated Statistics For Year 2009(Based on 1 full tract) A) Conventional B) Refinancings Number Average Value Number Average Value
LOANS ORIGINATED 2 $116,500 0 $0 APPLICATIONS APPROVED, NOT ACCEPTED 0 $0 1 $166,000 APPLICATIONS DENIED 1 $118,000 0 $0 APPLICATIONS WITHDRAWN 0 $0 0 $0 FILES CLOSED FOR INCOMPLETENESS 0 $0 0 $0
Aggregated Statistics For Year 2008(Based on 1 full tract) A) Conventional C) Non-occupant Loans on Number Average Value Number Average Value
LOANS ORIGINATED 1 $81,000 1 $81,000 APPLICATIONS APPROVED, NOT ACCEPTED 2 $103,500 1 $47,000 APPLICATIONS DENIED 1 $47,000 0 $0 APPLICATIONS WITHDRAWN 1 $106,000 0 $0 FILES CLOSED FOR INCOMPLETENESS 0 $0 0 $0
Aggregated Statistics For Year 2007(Based on 1 full tract) A) Conventional B) Refinancings C) Non-occupant Loans on Number Average Value Number Average Value Number Average Value
LOANS ORIGINATED 9 $98,111 5 $117,800 3 $62,667 APPLICATIONS APPROVED, NOT ACCEPTED 3 $43,667 0 $0 0 $0 APPLICATIONS DENIED 0 $0 0 $0 0 $0 APPLICATIONS WITHDRAWN 0 $0 0 $0 0 $0 FILES CLOSED FOR INCOMPLETENESS 0 $0 0 $0 0 $0
Aggregated Statistics For Year 2006(Based on 1 full tract) A) Conventional B) Refinancings C) Non-occupant Loans on Number Average Value Number Average Value Number Average Value
LOANS ORIGINATED 4 $126,000 2 $124,000 1 $130,000 APPLICATIONS APPROVED, NOT ACCEPTED 0 $0 0 $0 0 $0 APPLICATIONS DENIED 0 $0 0 $0 0 $0 APPLICATIONS WITHDRAWN 0 $0 1 $130,000 0 $0 FILES CLOSED FOR INCOMPLETENESS 0 $0 0 $0 0 $0
Aggregated Statistics For Year 2005(Based on 1 full tract) A) Conventional B) Refinancings C) Non-occupant Loans on Number Average Value Number Average Value Number Average Value
LOANS ORIGINATED 8 $94,625 0 $0 3 $92,000 APPLICATIONS APPROVED, NOT ACCEPTED 2 $54,000 0 $0 1 $73,000 APPLICATIONS DENIED 0 $0 1 $77,000 0 $0 APPLICATIONS WITHDRAWN 0 $0 0 $0 0 $0 FILES CLOSED FOR INCOMPLETENESS 0 $0 0 $0 0 $0
Aggregated Statistics For Year 2004(Based on 1 full tract) A) Conventional B) Refinancings C) Non-occupant Loans on Number Average Value Number Average Value Number Average Value
LOANS ORIGINATED 5 $93,600 3 $94,333 0 $0 APPLICATIONS APPROVED, NOT ACCEPTED 1 $70,000 1 $76,000 0 $0 APPLICATIONS DENIED 0 $0 1 $54,000 1 $54,000 APPLICATIONS WITHDRAWN 0 $0 0 $0 0 $0 FILES CLOSED FOR INCOMPLETENESS 0 $0 0 $0 0 $0
Aggregated Statistics For Year 2003(Based on 1 full tract) A) Conventional B) Refinancings Number Average Value Number Average Value
LOANS ORIGINATED 8 $79,000 6 $89,000 APPLICATIONS APPROVED, NOT ACCEPTED 2 $78,500 3 $86,000 APPLICATIONS DENIED 0 $0 0 $0 APPLICATIONS WITHDRAWN 0 $0 0 $0 FILES CLOSED FOR INCOMPLETENESS 0 $0 0 $0
Aggregated Statistics For Year 2002(Based on 1 full tract) A) Conventional B) Refinancings C) Non-occupant Loans on Number Average Value Number Average Value Number Average Value
LOANS ORIGINATED 5 $88,200 3 $101,000 1 $41,000 APPLICATIONS APPROVED, NOT ACCEPTED 1 $48,000 2 $79,500 1 $59,000 APPLICATIONS DENIED 0 $0 0 $0 0 $0 APPLICATIONS WITHDRAWN 0 $0 0 $0 0 $0 FILES CLOSED FOR INCOMPLETENESS 0 $0 0 $0 0 $0
Aggregated Statistics For Year 2001(Based on 1 full tract) A) Conventional B) Refinancings C) Non-occupant Loans on Number Average Value Number Average Value Number Average Value
LOANS ORIGINATED 4 $79,500 1 $95,000 0 $0 APPLICATIONS APPROVED, NOT ACCEPTED 1 $71,000 2 $77,000 1 $59,000 APPLICATIONS DENIED 0 $0 0 $0 0 $0 APPLICATIONS WITHDRAWN 0 $0 0 $0 0 $0 FILES CLOSED FOR INCOMPLETENESS 0 $0 0 $0 0 $0
Aggregated Statistics For Year 2000(Based on 1 full tract) A) Conventional B) Refinancings Number Average Value Number Average Value
LOANS ORIGINATED 7 $90,857 2 $78,500 APPLICATIONS APPROVED, NOT ACCEPTED 0 $0 0 $0 APPLICATIONS DENIED 0 $0 0 $0 APPLICATIONS WITHDRAWN 0 $0 0 $0 FILES CLOSED FOR INCOMPLETENESS 0 $0 0 $0
Aggregated Statistics For Year 1999(Based on 1 full tract) A) Conventional B) Refinancings Number Average Value Number Average Value
LOANS ORIGINATED 2 $58,340 1 $41,530 APPLICATIONS APPROVED, NOT ACCEPTED 0 $0 0 $0 APPLICATIONS DENIED 0 $0 0 $0 APPLICATIONS WITHDRAWN 0 $0 0 $0 FILES CLOSED FOR INCOMPLETENESS 0 $0 0 $0
Detailed PMIC statistics for the following Tracts:
0203.01
Fire-safe hotels and motels in Pulaski, New York:
Log Cabin Inn Inc, 7540 Salina St, Pulaski, New York 13142 Phone: (315) 298-6668
Redwood Motel, 3723 State Rt 13, Pulaski, New York 13142 Phone: (315) 298-4717, Fax: (315) 298-4717
Super 8, 3800 State Rt 13, Pulaski, New York 13142 Phone: (315) 298-4888, Fax: (315) 298-3293
All 3 fire-safe hotels and motels in Pulaski, New York
Most common first names in Pulaski, NY among deceased individuals Name Count Lived (average)
John 47 73.7 years William 44 73.4 years Charles 37 70.4 years Robert 34 69.7 years George 32 78.1 years Mary 32 80.0 years Dorothy 31 80.4 years Richard 28 69.2 years Ruth 27 77.6 years Harold 27 73.5 years
Most common last names in Pulaski, NY among deceased individuals Last name Count Lived (average)
Smith 22 77.3 years Johnson 17 78.5 years Hilton 17 74.9 years Miller 12 78.0 years Jones 10 73.1 years Robinson 10 76.9 years Williams 10 74.9 years Sanderson 10 77.1 years Wilder 10 76.2 years Allen 10 73.1 years
Pulaski compared to New York state average:
Median house value significantly below state average. Black race population percentage significantly below state average. Hispanic race population percentage significantly below state average. Foreign-born population percentage significantly below state average. Length of stay since moving in significantly below state average. Number of college students below state average.
Top Patent Applicants
Thomas William Tighe (2)
John J. Jacobs (2)
Thomas W. Tighe (1)
Michael Stone (1)
Gary Stephen Stasonis (1)
Michael E. Murphy (1)
Lawrence G. Hudson (1)
Captain Donald Quackenbush (1)
Total of 10 patent applications in 2008-2024.
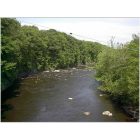
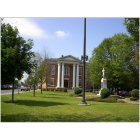
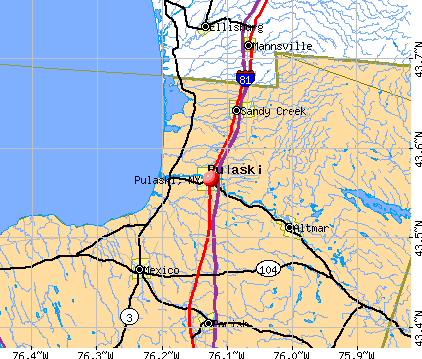


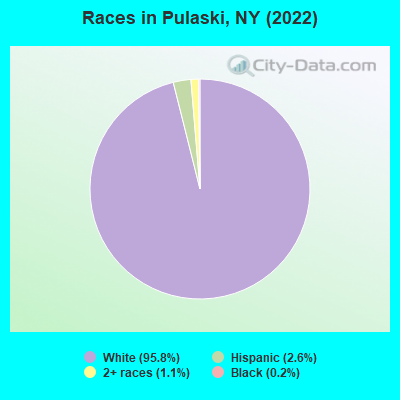
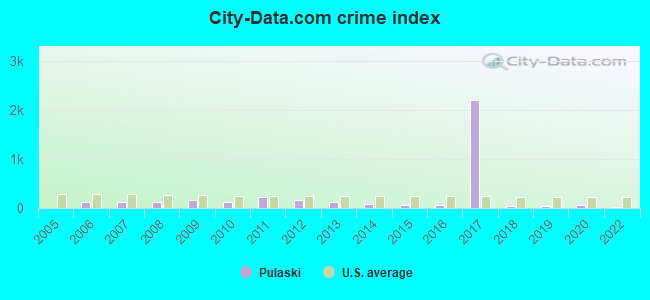
 Recent articles from our blog. Our writers, many of them Ph.D. graduates or candidates, create easy-to-read articles on a wide variety of topics.

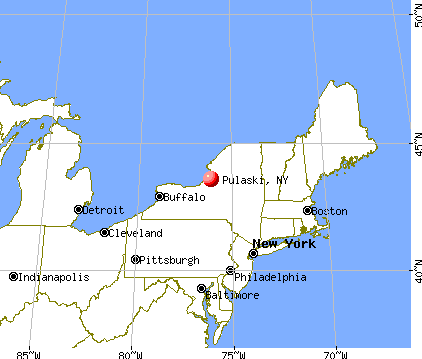
 (28.9 miles
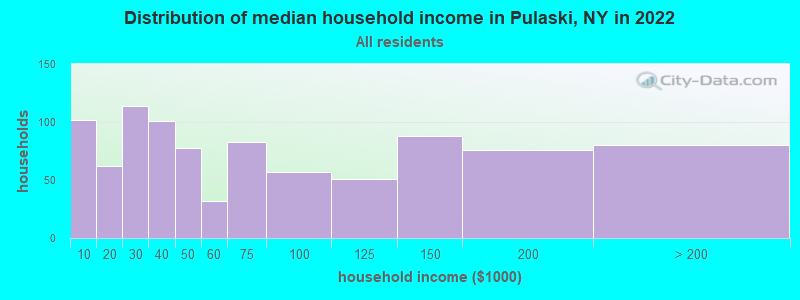
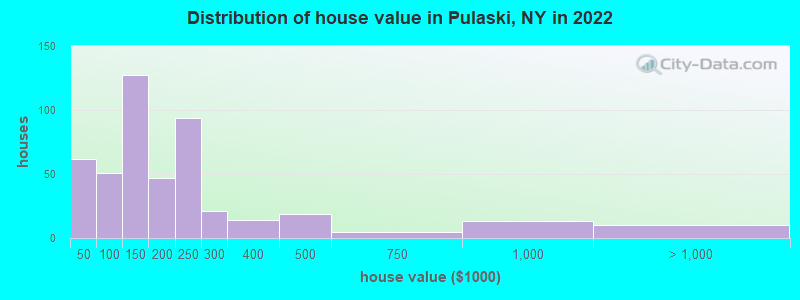

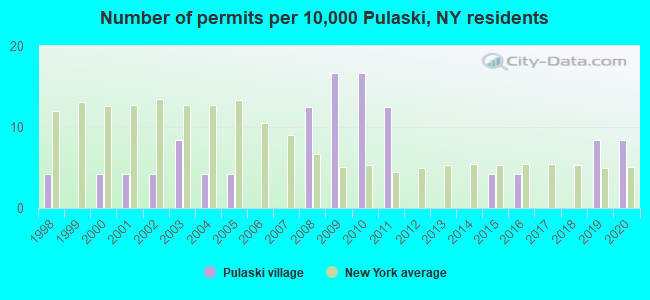
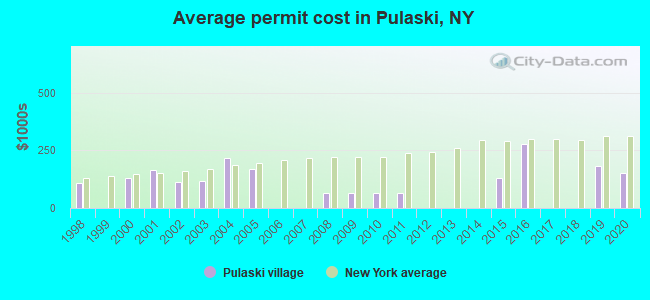
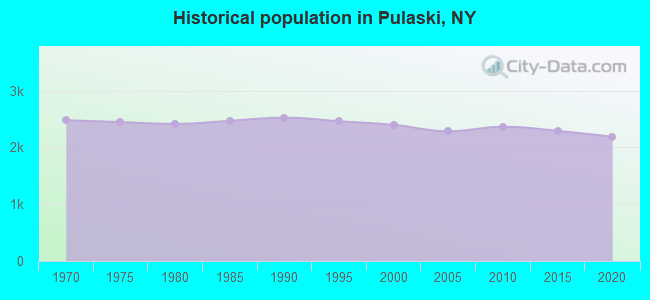
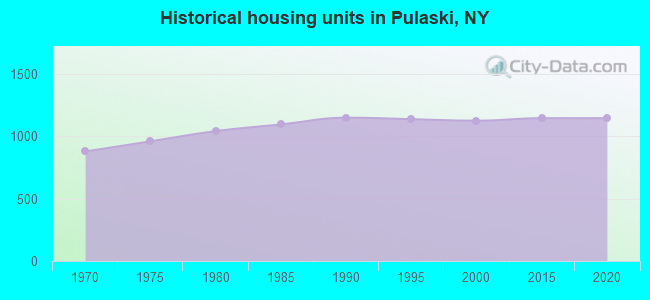
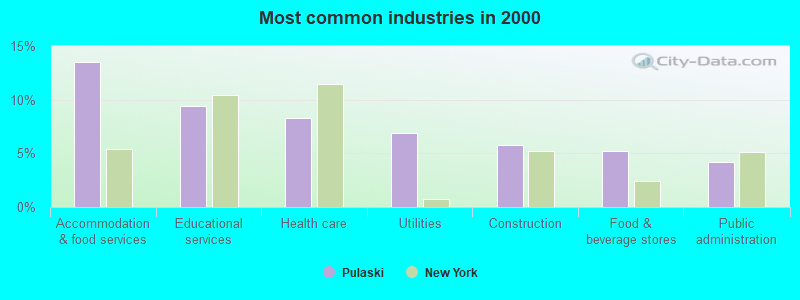
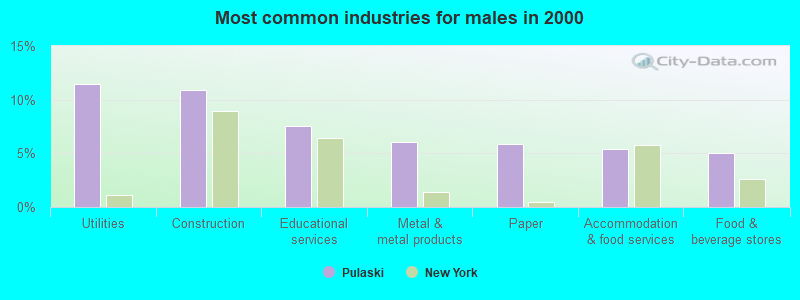
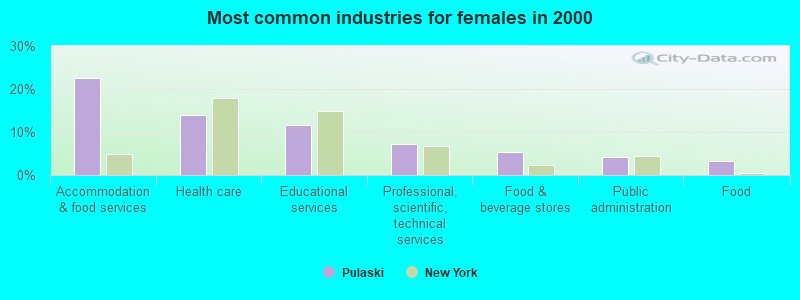
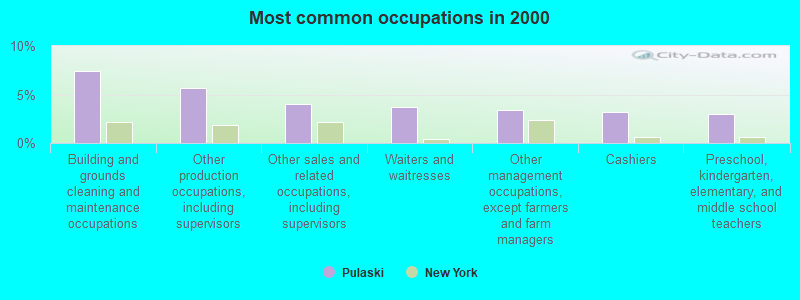
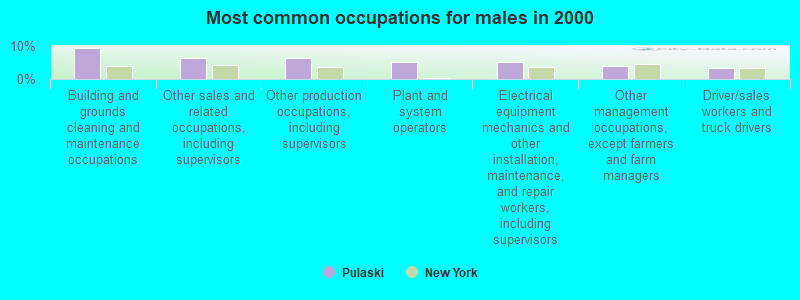
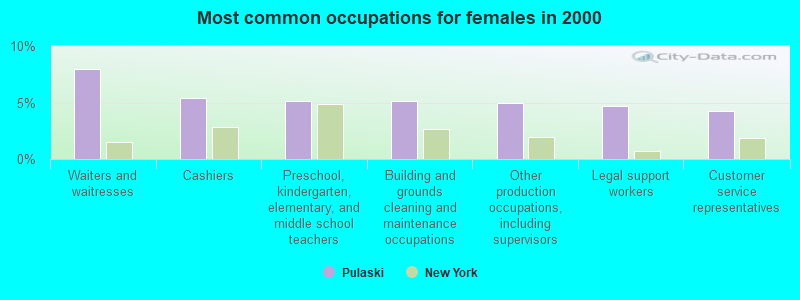


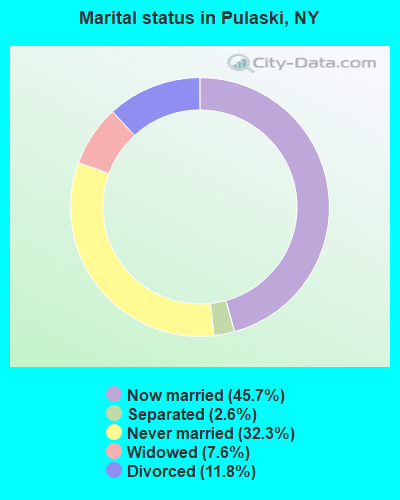
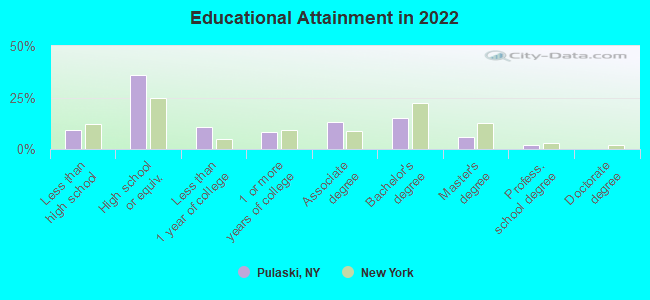
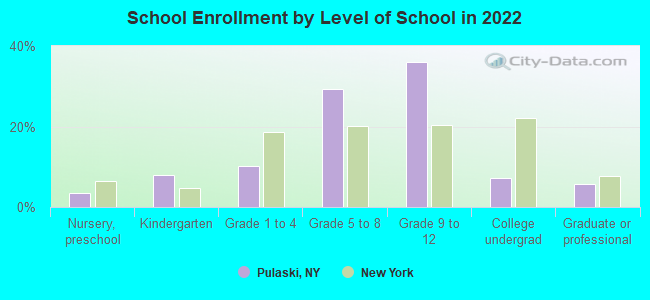
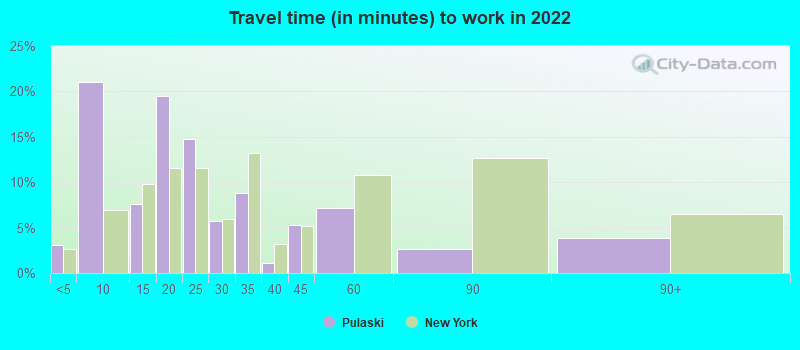
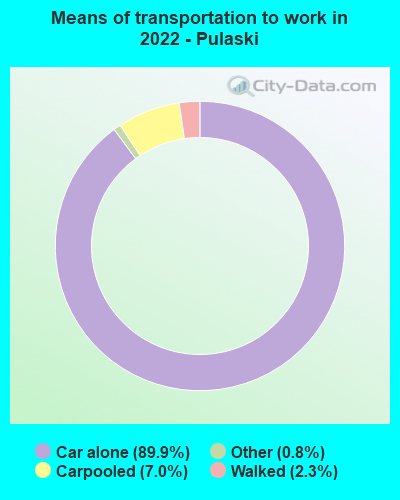
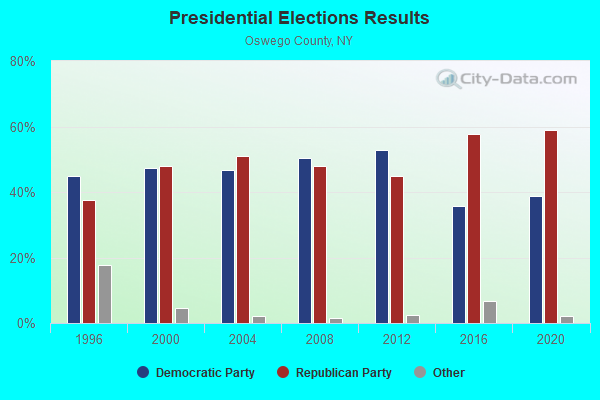
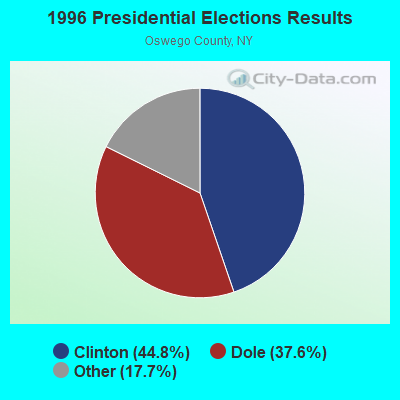
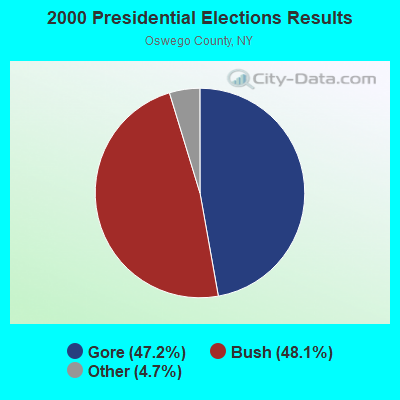
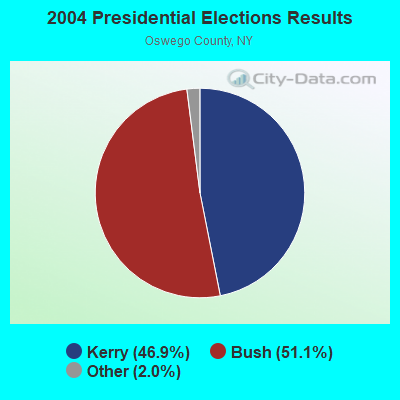
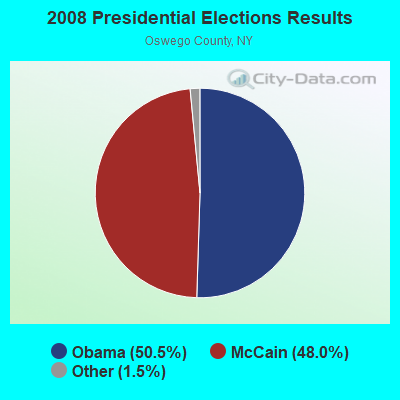
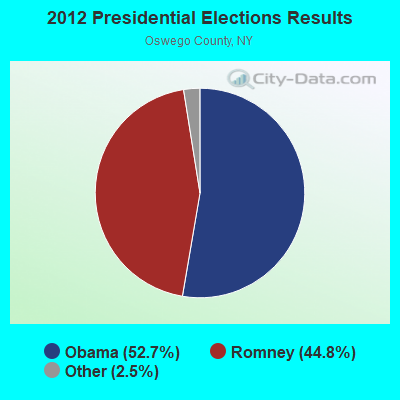
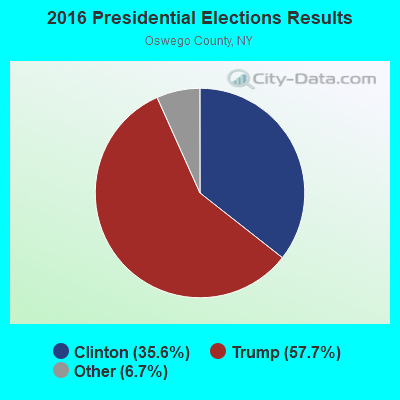
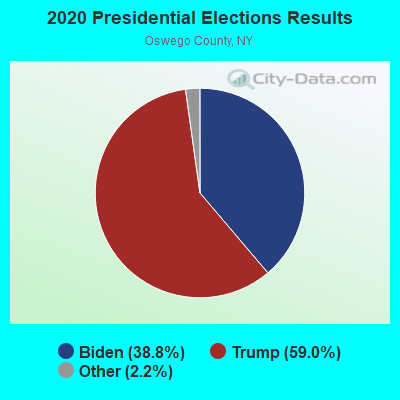
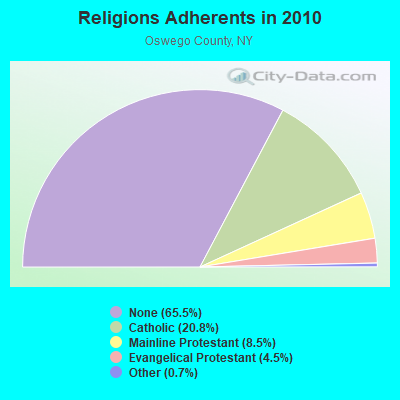
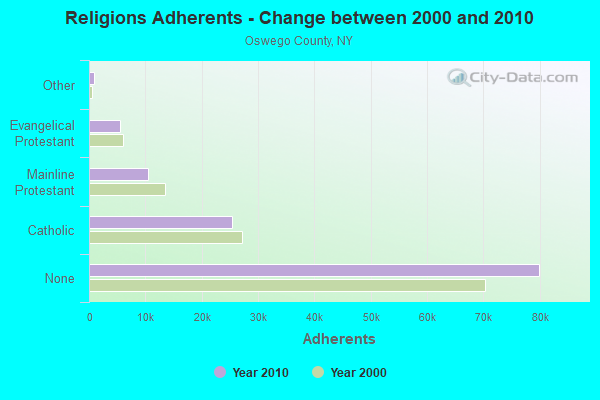
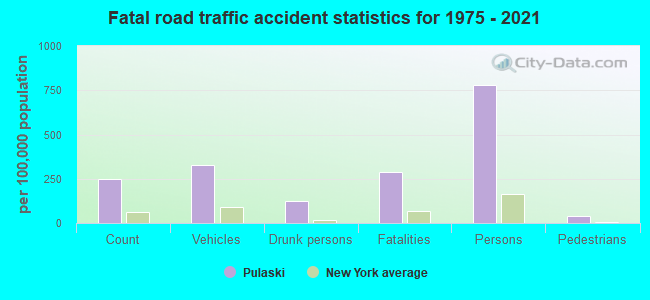
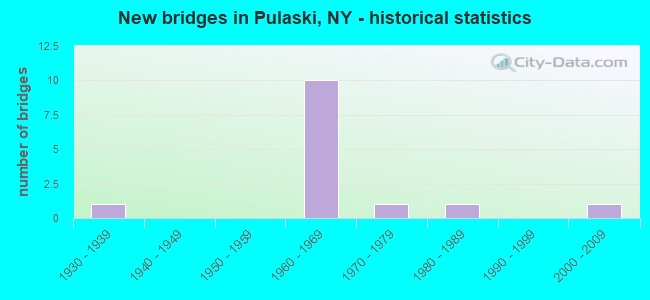
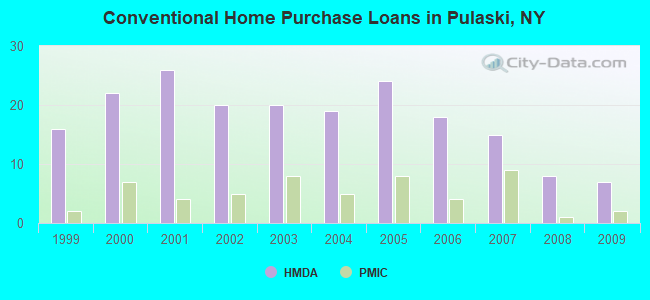
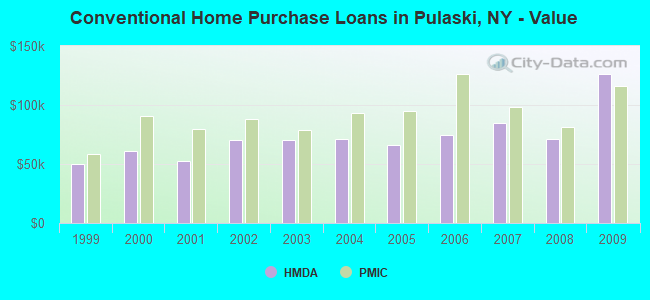
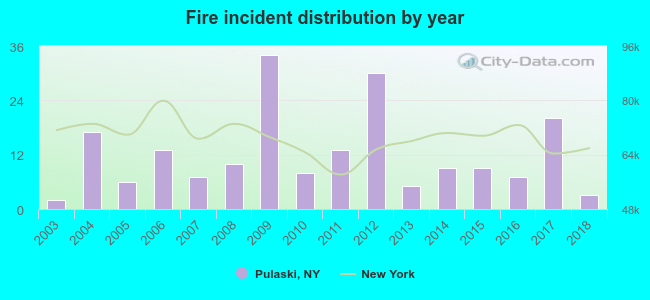 According to the data from the years 2003 - 2018 the average number of fire incidents per year is 12. The highest number of reported fire incidents - 34 took place in 2009, and the least - 2 in 2003. The data has a rising trend.
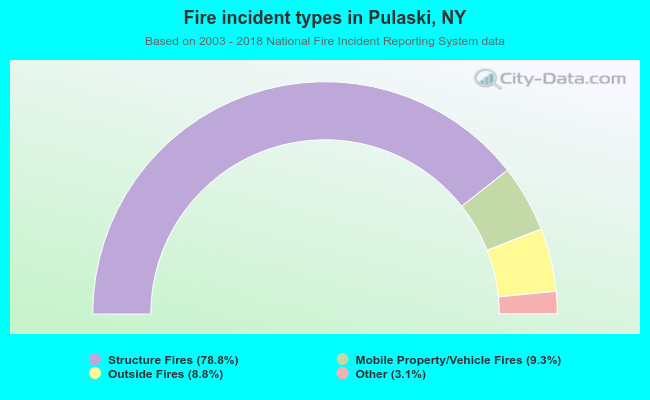 When looking into fire subcategories, the most reports belonged to: Structure Fires (78.8%), and Mobile Property/Vehicle Fires (9.3%).