Pulaski: Fire Incidents, New York (NY)
Where are fire incidents reported in Pulaski, NY
Something went wrong! Please refresh the page.
|
| |||||||||||||||||||||||||||||||||||||||||||||||||||||||||||||||||||||||||||||||||||||||||||||||||||||||||||||
2003 - 2018 National Fire Incident Reporting System (NFIRS) incidents
- Incident types reported to NFIRS in Pulaski, NY
- 67241.7%Rescue & EMS
- 32520.2%Good Intent Call
- 20212.5%Hazardous Condition
- 19312.0%Fire
- 1408.7%Service Call
- 734.5%False Alarm
- 40.2%Overpressure Rupture
- 20.1%Special Incident
- Fire incident types reported to NFIRS in Pulaski, NY
- 15278.8%Structure Fires
- 189.3%Mobile Property/Vehicle Fires
- 178.8%Outside Fires
- 63.1%Other
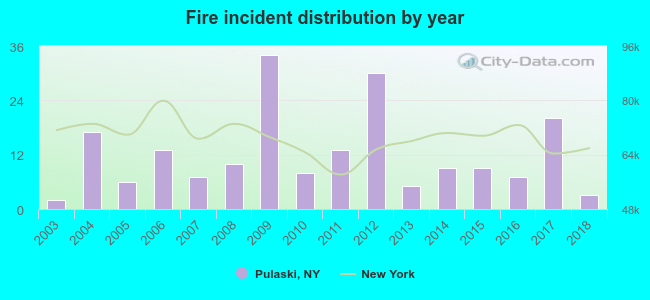 Based on the data from the years 2003 - 2018 the average number of fire incidents per year is 12. The highest number of fire incidents - 34 took place in 2009, and the least - 2 in 2003. The data has a growing trend.
 43.5% incidents where reported in the morning and 56.5% in the evening. The most fires (20.2%) took place on Monday, and the least (9.8%) on Tuesday.
 According to the 193 reports from years 2003 - 2018 most fires (18.1%) took place during April, and the least (2.6%) in September.
 Out of all 1,612 cases reported during the years 2003 - 2018, the most belonged to the categories: Rescue & EMS (41.7%), Good Intent Call (20.2%), and Hazardous Condition (12.5%).
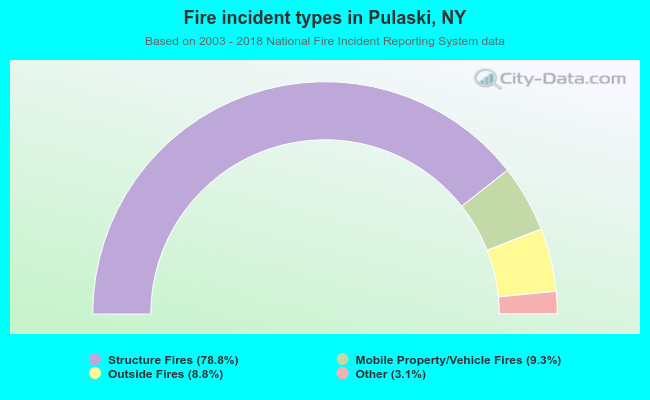 When looking into fire subcategories, the most incidents belonged to: Structure Fires (78.8%), and Mobile Property/Vehicle Fires (9.3%).