Covington, Washington Submit your own pictures of this city and show them to the world
OSM Map
General Map
Google Map
MSN Map
OSM Map
General Map
Google Map
MSN Map
OSM Map
General Map
Google Map
MSN Map
OSM Map
General Map
Google Map
MSN Map
Please wait while loading the map...
Population in 2022: 21,374 (100% urban, 0% rural). Population change since 2000: +55.1%Males: 10,943 Females: 10,431
March 2022 cost of living index in Covington: 111.5 (more than average, U.S. average is 100) Percentage of residents living in poverty in 2022: 5.0%for White Non-Hispanic residents , 8.1% for Black residents , 7.1% for Hispanic or Latino residents , 14.9% for other race residents , 7.0% for two or more races residents )
Profiles of local businesses
Business Search - 14 Million verified businesses
Data:
Median household income ($)
Median household income (% change since 2000)
Household income diversity
Ratio of average income to average house value (%)
Ratio of average income to average rent
Median household income ($) - White
Median household income ($) - Black or African American
Median household income ($) - Asian
Median household income ($) - Hispanic or Latino
Median household income ($) - American Indian and Alaska Native
Median household income ($) - Multirace
Median household income ($) - Other Race
Median household income for houses/condos with a mortgage ($)
Median household income for apartments without a mortgage ($)
Races - White alone (%)
Races - White alone (% change since 2000)
Races - Black alone (%)
Races - Black alone (% change since 2000)
Races - American Indian alone (%)
Races - American Indian alone (% change since 2000)
Races - Asian alone (%)
Races - Asian alone (% change since 2000)
Races - Hispanic (%)
Races - Hispanic (% change since 2000)
Races - Native Hawaiian and Other Pacific Islander alone (%)
Races - Native Hawaiian and Other Pacific Islander alone (% change since 2000)
Races - Two or more races (%)
Races - Two or more races (% change since 2000)
Races - Other race alone (%)
Races - Other race alone (% change since 2000)
Racial diversity
Unemployment (%)
Unemployment (% change since 2000)
Unemployment (%) - White
Unemployment (%) - Black or African American
Unemployment (%) - Asian
Unemployment (%) - Hispanic or Latino
Unemployment (%) - American Indian and Alaska Native
Unemployment (%) - Multirace
Unemployment (%) - Other Race
Population density (people per square mile)
Population - Males (%)
Population - Females (%)
Population - Males (%) - White
Population - Males (%) - Black or African American
Population - Males (%) - Asian
Population - Males (%) - Hispanic or Latino
Population - Males (%) - American Indian and Alaska Native
Population - Males (%) - Multirace
Population - Males (%) - Other Race
Population - Females (%) - White
Population - Females (%) - Black or African American
Population - Females (%) - Asian
Population - Females (%) - Hispanic or Latino
Population - Females (%) - American Indian and Alaska Native
Population - Females (%) - Multirace
Population - Females (%) - Other Race
Coronavirus confirmed cases (Jun 27, 2024)
Deaths caused by coronavirus (Jun 27, 2024)
Coronavirus confirmed cases (per 100k population) (Jun 27, 2024)
Deaths caused by coronavirus (per 100k population) (Jun 27, 2024)
Daily increase in number of cases (Jun 27, 2024)
Weekly increase in number of cases (Jun 27, 2024)
Cases doubled (in days) (Jun 27, 2024)
Hospitalized patients (Apr 18, 2022)
Negative test results (Apr 18, 2022)
Total test results (Apr 18, 2022)
COVID Vaccine doses distributed (per 100k population) (Sep 19, 2023)
COVID Vaccine doses administered (per 100k population) (Sep 19, 2023)
COVID Vaccine doses distributed (Sep 19, 2023)
COVID Vaccine doses administered (Sep 19, 2023)
Likely homosexual households (%)
Likely homosexual households (% change since 2000)
Likely homosexual households - Lesbian couples (%)
Likely homosexual households - Lesbian couples (% change since 2000)
Likely homosexual households - Gay men (%)
Likely homosexual households - Gay men (% change since 2000)
Cost of living index
Median gross rent ($)
Median contract rent ($)
Median monthly housing costs ($)
Median house or condo value ($)
Median house or condo value ($ change since 2000)
Mean house or condo value by units in structure - 1, detached ($)
Mean house or condo value by units in structure - 1, attached ($)
Mean house or condo value by units in structure - 2 ($)
Mean house or condo value by units in structure by units in structure - 3 or 4 ($)
Mean house or condo value by units in structure - 5 or more ($)
Mean house or condo value by units in structure - Boat, RV, van, etc. ($)
Mean house or condo value by units in structure - Mobile home ($)
Median house or condo value ($) - White
Median house or condo value ($) - Black or African American
Median house or condo value ($) - Asian
Median house or condo value ($) - Hispanic or Latino
Median house or condo value ($) - American Indian and Alaska Native
Median house or condo value ($) - Multirace
Median house or condo value ($) - Other Race
Median resident age
Resident age diversity
Median resident age - Males
Median resident age - Females
Median resident age - White
Median resident age - Black or African American
Median resident age - Asian
Median resident age - Hispanic or Latino
Median resident age - American Indian and Alaska Native
Median resident age - Multirace
Median resident age - Other Race
Median resident age - Males - White
Median resident age - Males - Black or African American
Median resident age - Males - Asian
Median resident age - Males - Hispanic or Latino
Median resident age - Males - American Indian and Alaska Native
Median resident age - Males - Multirace
Median resident age - Males - Other Race
Median resident age - Females - White
Median resident age - Females - Black or African American
Median resident age - Females - Asian
Median resident age - Females - Hispanic or Latino
Median resident age - Females - American Indian and Alaska Native
Median resident age - Females - Multirace
Median resident age - Females - Other Race
Commute - mean travel time to work (minutes)
Travel time to work - Less than 5 minutes (%)
Travel time to work - Less than 5 minutes (% change since 2000)
Travel time to work - 5 to 9 minutes (%)
Travel time to work - 5 to 9 minutes (% change since 2000)
Travel time to work - 10 to 19 minutes (%)
Travel time to work - 10 to 19 minutes (% change since 2000)
Travel time to work - 20 to 29 minutes (%)
Travel time to work - 20 to 29 minutes (% change since 2000)
Travel time to work - 30 to 39 minutes (%)
Travel time to work - 30 to 39 minutes (% change since 2000)
Travel time to work - 40 to 59 minutes (%)
Travel time to work - 40 to 59 minutes (% change since 2000)
Travel time to work - 60 to 89 minutes (%)
Travel time to work - 60 to 89 minutes (% change since 2000)
Travel time to work - 90 or more minutes (%)
Travel time to work - 90 or more minutes (% change since 2000)
Marital status - Never married (%)
Marital status - Now married (%)
Marital status - Separated (%)
Marital status - Widowed (%)
Marital status - Divorced (%)
Median family income ($)
Median family income (% change since 2000)
Median non-family income ($)
Median non-family income (% change since 2000)
Median per capita income ($)
Median per capita income (% change since 2000)
Median family income ($) - White
Median family income ($) - Black or African American
Median family income ($) - Asian
Median family income ($) - Hispanic or Latino
Median family income ($) - American Indian and Alaska Native
Median family income ($) - Multirace
Median family income ($) - Other Race
Median year house/condo built
Median year apartment built
Year house built - Built 2005 or later (%)
Year house built - Built 2000 to 2004 (%)
Year house built - Built 1990 to 1999 (%)
Year house built - Built 1980 to 1989 (%)
Year house built - Built 1970 to 1979 (%)
Year house built - Built 1960 to 1969 (%)
Year house built - Built 1950 to 1959 (%)
Year house built - Built 1940 to 1949 (%)
Year house built - Built 1939 or earlier (%)
Average household size
Household density (households per square mile)
Average household size - White
Average household size - Black or African American
Average household size - Asian
Average household size - Hispanic or Latino
Average household size - American Indian and Alaska Native
Average household size - Multirace
Average household size - Other Race
Occupied housing units (%)
Vacant housing units (%)
Owner occupied housing units (%)
Renter occupied housing units (%)
Vacancy status - For rent (%)
Vacancy status - For sale only (%)
Vacancy status - Rented or sold, not occupied (%)
Vacancy status - For seasonal, recreational, or occasional use (%)
Vacancy status - For migrant workers (%)
Vacancy status - Other vacant (%)
Residents with income below the poverty level (%)
Residents with income below 50% of the poverty level (%)
Children below poverty level (%)
Poor families by family type - Married-couple family (%)
Poor families by family type - Male, no wife present (%)
Poor families by family type - Female, no husband present (%)
Poverty status for native-born residents (%)
Poverty status for foreign-born residents (%)
Poverty among high school graduates not in families (%)
Poverty among people who did not graduate high school not in families (%)
Residents with income below the poverty level (%) - White
Residents with income below the poverty level (%) - Black or African American
Residents with income below the poverty level (%) - Asian
Residents with income below the poverty level (%) - Hispanic or Latino
Residents with income below the poverty level (%) - American Indian and Alaska Native
Residents with income below the poverty level (%) - Multirace
Residents with income below the poverty level (%) - Other Race
Air pollution - Air Quality Index (AQI)
Air pollution - CO
Air pollution - NO2
Air pollution - SO2
Air pollution - Ozone
Air pollution - PM10
Air pollution - PM25
Air pollution - Pb
Crime - Murders per 100,000 population
Crime - Rapes per 100,000 population
Crime - Robberies per 100,000 population
Crime - Assaults per 100,000 population
Crime - Burglaries per 100,000 population
Crime - Thefts per 100,000 population
Crime - Auto thefts per 100,000 population
Crime - Arson per 100,000 population
Crime - City-data.com crime index
Crime - Violent crime index
Crime - Property crime index
Crime - Murders per 100,000 population (5 year average)
Crime - Rapes per 100,000 population (5 year average)
Crime - Robberies per 100,000 population (5 year average)
Crime - Assaults per 100,000 population (5 year average)
Crime - Burglaries per 100,000 population (5 year average)
Crime - Thefts per 100,000 population (5 year average)
Crime - Auto thefts per 100,000 population (5 year average)
Crime - Arson per 100,000 population (5 year average)
Crime - City-data.com crime index (5 year average)
Crime - Violent crime index (5 year average)
Crime - Property crime index (5 year average)
1996 Presidential Elections Results (%) - Democratic Party (Clinton)
1996 Presidential Elections Results (%) - Republican Party (Dole)
1996 Presidential Elections Results (%) - Other
2000 Presidential Elections Results (%) - Democratic Party (Gore)
2000 Presidential Elections Results (%) - Republican Party (Bush)
2000 Presidential Elections Results (%) - Other
2004 Presidential Elections Results (%) - Democratic Party (Kerry)
2004 Presidential Elections Results (%) - Republican Party (Bush)
2004 Presidential Elections Results (%) - Other
2008 Presidential Elections Results (%) - Democratic Party (Obama)
2008 Presidential Elections Results (%) - Republican Party (McCain)
2008 Presidential Elections Results (%) - Other
2012 Presidential Elections Results (%) - Democratic Party (Obama)
2012 Presidential Elections Results (%) - Republican Party (Romney)
2012 Presidential Elections Results (%) - Other
2016 Presidential Elections Results (%) - Democratic Party (Clinton)
2016 Presidential Elections Results (%) - Republican Party (Trump)
2016 Presidential Elections Results (%) - Other
2020 Presidential Elections Results (%) - Democratic Party (Biden)
2020 Presidential Elections Results (%) - Republican Party (Trump)
2020 Presidential Elections Results (%) - Other
Ancestries Reported - Arab (%)
Ancestries Reported - Czech (%)
Ancestries Reported - Danish (%)
Ancestries Reported - Dutch (%)
Ancestries Reported - English (%)
Ancestries Reported - French (%)
Ancestries Reported - French Canadian (%)
Ancestries Reported - German (%)
Ancestries Reported - Greek (%)
Ancestries Reported - Hungarian (%)
Ancestries Reported - Irish (%)
Ancestries Reported - Italian (%)
Ancestries Reported - Lithuanian (%)
Ancestries Reported - Norwegian (%)
Ancestries Reported - Polish (%)
Ancestries Reported - Portuguese (%)
Ancestries Reported - Russian (%)
Ancestries Reported - Scotch-Irish (%)
Ancestries Reported - Scottish (%)
Ancestries Reported - Slovak (%)
Ancestries Reported - Subsaharan African (%)
Ancestries Reported - Swedish (%)
Ancestries Reported - Swiss (%)
Ancestries Reported - Ukrainian (%)
Ancestries Reported - United States (%)
Ancestries Reported - Welsh (%)
Ancestries Reported - West Indian (%)
Ancestries Reported - Other (%)
Educational Attainment - No schooling completed (%)
Educational Attainment - Less than high school (%)
Educational Attainment - High school or equivalent (%)
Educational Attainment - Less than 1 year of college (%)
Educational Attainment - 1 or more years of college (%)
Educational Attainment - Associate degree (%)
Educational Attainment - Bachelor's degree (%)
Educational Attainment - Master's degree (%)
Educational Attainment - Professional school degree (%)
Educational Attainment - Doctorate degree (%)
School Enrollment - Nursery, preschool (%)
School Enrollment - Kindergarten (%)
School Enrollment - Grade 1 to 4 (%)
School Enrollment - Grade 5 to 8 (%)
School Enrollment - Grade 9 to 12 (%)
School Enrollment - College undergrad (%)
School Enrollment - Graduate or professional (%)
School Enrollment - Not enrolled in school (%)
School enrollment - Public schools (%)
School enrollment - Private schools (%)
School enrollment - Not enrolled (%)
Median number of rooms in houses and condos
Median number of rooms in apartments
Housing units lacking complete plumbing facilities (%)
Housing units lacking complete kitchen facilities (%)
Density of houses
Urban houses (%)
Rural houses (%)
Households with people 60 years and over (%)
Households with people 65 years and over (%)
Households with people 75 years and over (%)
Households with one or more nonrelatives (%)
Households with no nonrelatives (%)
Population in households (%)
Family households (%)
Nonfamily households (%)
Population in families (%)
Family households with own children (%)
Median number of bedrooms in owner occupied houses
Mean number of bedrooms in owner occupied houses
Median number of bedrooms in renter occupied houses
Mean number of bedrooms in renter occupied houses
Median number of vehichles in owner occupied houses
Mean number of vehichles in owner occupied houses
Median number of vehichles in renter occupied houses
Mean number of vehichles in renter occupied houses
Mortgage status - with mortgage (%)
Mortgage status - with second mortgage (%)
Mortgage status - with home equity loan (%)
Mortgage status - with both second mortgage and home equity loan (%)
Mortgage status - without a mortgage (%)
Average family size
Average family size - White
Average family size - Black or African American
Average family size - Asian
Average family size - Hispanic or Latino
Average family size - American Indian and Alaska Native
Average family size - Multirace
Average family size - Other Race
Geographical mobility - Same house 1 year ago (%)
Geographical mobility - Moved within same county (%)
Geographical mobility - Moved from different county within same state (%)
Geographical mobility - Moved from different state (%)
Geographical mobility - Moved from abroad (%)
Place of birth - Born in state of residence (%)
Place of birth - Born in other state (%)
Place of birth - Native, outside of US (%)
Place of birth - Foreign born (%)
Housing units in structures - 1, detached (%)
Housing units in structures - 1, attached (%)
Housing units in structures - 2 (%)
Housing units in structures - 3 or 4 (%)
Housing units in structures - 5 to 9 (%)
Housing units in structures - 10 to 19 (%)
Housing units in structures - 20 to 49 (%)
Housing units in structures - 50 or more (%)
Housing units in structures - Mobile home (%)
Housing units in structures - Boat, RV, van, etc. (%)
House/condo owner moved in on average (years ago)
Renter moved in on average (years ago)
Year householder moved into unit - Moved in 1999 to March 2000 (%)
Year householder moved into unit - Moved in 1995 to 1998 (%)
Year householder moved into unit - Moved in 1990 to 1994 (%)
Year householder moved into unit - Moved in 1980 to 1989 (%)
Year householder moved into unit - Moved in 1970 to 1979 (%)
Year householder moved into unit - Moved in 1969 or earlier (%)
Means of transportation to work - Drove car alone (%)
Means of transportation to work - Carpooled (%)
Means of transportation to work - Public transportation (%)
Means of transportation to work - Bus or trolley bus (%)
Means of transportation to work - Streetcar or trolley car (%)
Means of transportation to work - Subway or elevated (%)
Means of transportation to work - Railroad (%)
Means of transportation to work - Ferryboat (%)
Means of transportation to work - Taxicab (%)
Means of transportation to work - Motorcycle (%)
Means of transportation to work - Bicycle (%)
Means of transportation to work - Walked (%)
Means of transportation to work - Other means (%)
Working at home (%)
Industry diversity
Most Common Industries - Agriculture, forestry, fishing and hunting, and mining (%)
Most Common Industries - Agriculture, forestry, fishing and hunting (%)
Most Common Industries - Mining, quarrying, and oil and gas extraction (%)
Most Common Industries - Construction (%)
Most Common Industries - Manufacturing (%)
Most Common Industries - Wholesale trade (%)
Most Common Industries - Retail trade (%)
Most Common Industries - Transportation and warehousing, and utilities (%)
Most Common Industries - Transportation and warehousing (%)
Most Common Industries - Utilities (%)
Most Common Industries - Information (%)
Most Common Industries - Finance and insurance, and real estate and rental and leasing (%)
Most Common Industries - Finance and insurance (%)
Most Common Industries - Real estate and rental and leasing (%)
Most Common Industries - Professional, scientific, and management, and administrative and waste management services (%)
Most Common Industries - Professional, scientific, and technical services (%)
Most Common Industries - Management of companies and enterprises (%)
Most Common Industries - Administrative and support and waste management services (%)
Most Common Industries - Educational services, and health care and social assistance (%)
Most Common Industries - Educational services (%)
Most Common Industries - Health care and social assistance (%)
Most Common Industries - Arts, entertainment, and recreation, and accommodation and food services (%)
Most Common Industries - Arts, entertainment, and recreation (%)
Most Common Industries - Accommodation and food services (%)
Most Common Industries - Other services, except public administration (%)
Most Common Industries - Public administration (%)
Occupation diversity
Most Common Occupations - Management, business, science, and arts occupations (%)
Most Common Occupations - Management, business, and financial occupations (%)
Most Common Occupations - Management occupations (%)
Most Common Occupations - Business and financial operations occupations (%)
Most Common Occupations - Computer, engineering, and science occupations (%)
Most Common Occupations - Computer and mathematical occupations (%)
Most Common Occupations - Architecture and engineering occupations (%)
Most Common Occupations - Life, physical, and social science occupations (%)
Most Common Occupations - Education, legal, community service, arts, and media occupations (%)
Most Common Occupations - Community and social service occupations (%)
Most Common Occupations - Legal occupations (%)
Most Common Occupations - Education, training, and library occupations (%)
Most Common Occupations - Arts, design, entertainment, sports, and media occupations (%)
Most Common Occupations - Healthcare practitioners and technical occupations (%)
Most Common Occupations - Health diagnosing and treating practitioners and other technical occupations (%)
Most Common Occupations - Health technologists and technicians (%)
Most Common Occupations - Service occupations (%)
Most Common Occupations - Healthcare support occupations (%)
Most Common Occupations - Protective service occupations (%)
Most Common Occupations - Fire fighting and prevention, and other protective service workers including supervisors (%)
Most Common Occupations - Law enforcement workers including supervisors (%)
Most Common Occupations - Food preparation and serving related occupations (%)
Most Common Occupations - Building and grounds cleaning and maintenance occupations (%)
Most Common Occupations - Personal care and service occupations (%)
Most Common Occupations - Sales and office occupations (%)
Most Common Occupations - Sales and related occupations (%)
Most Common Occupations - Office and administrative support occupations (%)
Most Common Occupations - Natural resources, construction, and maintenance occupations (%)
Most Common Occupations - Farming, fishing, and forestry occupations (%)
Most Common Occupations - Construction and extraction occupations (%)
Most Common Occupations - Installation, maintenance, and repair occupations (%)
Most Common Occupations - Production, transportation, and material moving occupations (%)
Most Common Occupations - Production occupations (%)
Most Common Occupations - Transportation occupations (%)
Most Common Occupations - Material moving occupations (%)
People in Group quarters - Institutionalized population (%)
People in Group quarters - Correctional institutions (%)
People in Group quarters - Federal prisons and detention centers (%)
People in Group quarters - Halfway houses (%)
People in Group quarters - Local jails and other confinement facilities (including police lockups) (%)
People in Group quarters - Military disciplinary barracks (%)
People in Group quarters - State prisons (%)
People in Group quarters - Other types of correctional institutions (%)
People in Group quarters - Nursing homes (%)
People in Group quarters - Hospitals/wards, hospices, and schools for the handicapped (%)
People in Group quarters - Hospitals/wards and hospices for chronically ill (%)
People in Group quarters - Hospices or homes for chronically ill (%)
People in Group quarters - Military hospitals or wards for chronically ill (%)
People in Group quarters - Other hospitals or wards for chronically ill (%)
People in Group quarters - Hospitals or wards for drug/alcohol abuse (%)
People in Group quarters - Mental (Psychiatric) hospitals or wards (%)
People in Group quarters - Schools, hospitals, or wards for the mentally retarded (%)
People in Group quarters - Schools, hospitals, or wards for the physically handicapped (%)
People in Group quarters - Institutions for the deaf (%)
People in Group quarters - Institutions for the blind (%)
People in Group quarters - Orthopedic wards and institutions for the physically handicapped (%)
People in Group quarters - Wards in general hospitals for patients who have no usual home elsewhere (%)
People in Group quarters - Wards in military hospitals for patients who have no usual home elsewhere (%)
People in Group quarters - Juvenile institutions (%)
People in Group quarters - Long-term care (%)
People in Group quarters - Homes for abused, dependent, and neglected children (%)
People in Group quarters - Residential treatment centers for emotionally disturbed children (%)
People in Group quarters - Training schools for juvenile delinquents (%)
People in Group quarters - Short-term care, detention or diagnostic centers for delinquent children (%)
People in Group quarters - Type of juvenile institution unknown (%)
People in Group quarters - Noninstitutionalized population (%)
People in Group quarters - College dormitories (includes college quarters off campus) (%)
People in Group quarters - Military quarters (%)
People in Group quarters - On base (%)
People in Group quarters - Barracks, unaccompanied personnel housing (UPH), (Enlisted/Officer), ;and similar group living quarters for military personnel (%)
People in Group quarters - Transient quarters for temporary residents (%)
People in Group quarters - Military ships (%)
People in Group quarters - Group homes (%)
People in Group quarters - Homes or halfway houses for drug/alcohol abuse (%)
People in Group quarters - Homes for the mentally ill (%)
People in Group quarters - Homes for the mentally retarded (%)
People in Group quarters - Homes for the physically handicapped (%)
People in Group quarters - Other group homes (%)
People in Group quarters - Religious group quarters (%)
People in Group quarters - Dormitories (%)
People in Group quarters - Agriculture workers' dormitories on farms (%)
People in Group quarters - Job Corps and vocational training facilities (%)
People in Group quarters - Other workers' dormitories (%)
People in Group quarters - Crews of maritime vessels (%)
People in Group quarters - Other nonhousehold living situations (%)
People in Group quarters - Other noninstitutional group quarters (%)
Residents speaking English at home (%)
Residents speaking English at home - Born in the United States (%)
Residents speaking English at home - Native, born elsewhere (%)
Residents speaking English at home - Foreign born (%)
Residents speaking Spanish at home (%)
Residents speaking Spanish at home - Born in the United States (%)
Residents speaking Spanish at home - Native, born elsewhere (%)
Residents speaking Spanish at home - Foreign born (%)
Residents speaking other language at home (%)
Residents speaking other language at home - Born in the United States (%)
Residents speaking other language at home - Native, born elsewhere (%)
Residents speaking other language at home - Foreign born (%)
Class of Workers - Employee of private company (%)
Class of Workers - Self-employed in own incorporated business (%)
Class of Workers - Private not-for-profit wage and salary workers (%)
Class of Workers - Local government workers (%)
Class of Workers - State government workers (%)
Class of Workers - Federal government workers (%)
Class of Workers - Self-employed workers in own not incorporated business and Unpaid family workers (%)
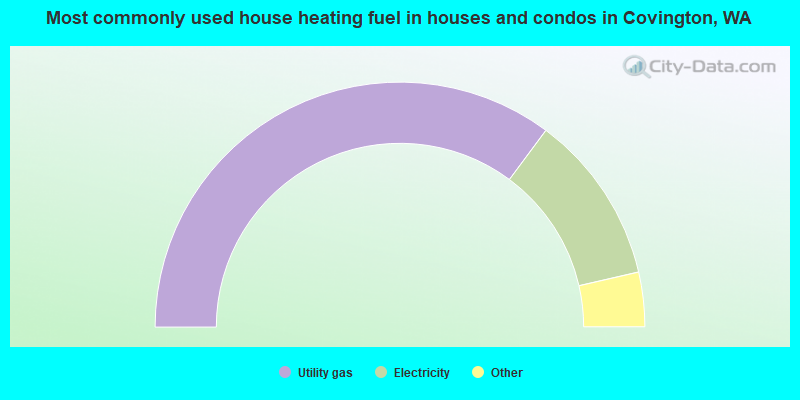
House heating fuel used in houses and condos - Utility gas (%)
House heating fuel used in houses and condos - Bottled, tank, or LP gas (%)
House heating fuel used in houses and condos - Electricity (%)
House heating fuel used in houses and condos - Fuel oil, kerosene, etc. (%)
House heating fuel used in houses and condos - Coal or coke (%)
House heating fuel used in houses and condos - Wood (%)
House heating fuel used in houses and condos - Solar energy (%)
House heating fuel used in houses and condos - Other fuel (%)
House heating fuel used in houses and condos - No fuel used (%)
House heating fuel used in apartments - Utility gas (%)
House heating fuel used in apartments - Bottled, tank, or LP gas (%)
House heating fuel used in apartments - Electricity (%)
House heating fuel used in apartments - Fuel oil, kerosene, etc. (%)
House heating fuel used in apartments - Coal or coke (%)
House heating fuel used in apartments - Wood (%)
House heating fuel used in apartments - Solar energy (%)
House heating fuel used in apartments - Other fuel (%)
House heating fuel used in apartments - No fuel used (%)
Armed forces status - In Armed Forces (%)
Armed forces status - Civilian (%)
Armed forces status - Civilian - Veteran (%)
Armed forces status - Civilian - Nonveteran (%)
Fatal accidents locations in years 2005-2021
Fatal accidents locations in 2005
Fatal accidents locations in 2006
Fatal accidents locations in 2007
Fatal accidents locations in 2008
Fatal accidents locations in 2009
Fatal accidents locations in 2010
Fatal accidents locations in 2011
Fatal accidents locations in 2012
Fatal accidents locations in 2013
Fatal accidents locations in 2014
Fatal accidents locations in 2015
Fatal accidents locations in 2016
Fatal accidents locations in 2017
Fatal accidents locations in 2018
Fatal accidents locations in 2019
Fatal accidents locations in 2020
Fatal accidents locations in 2021
Alcohol use - People drinking some alcohol every month (%)
Alcohol use - People not drinking at all (%)
Alcohol use - Average days/month drinking alcohol
Alcohol use - Average drinks/week
Alcohol use - Average days/year people drink much
Audiometry - Average condition of hearing (%)
Audiometry - People that can hear a whisper from across a quiet room (%)
Audiometry - People that can hear normal voice from across a quiet room (%)
Audiometry - Ears ringing, roaring, buzzing (%)
Audiometry - Had a job exposure to loud noise (%)
Audiometry - Had off-work exposure to loud noise (%)
Blood Pressure & Cholesterol - Has high blood pressure (%)
Blood Pressure & Cholesterol - Checking blood pressure at home (%)
Blood Pressure & Cholesterol - Frequently checking blood cholesterol (%)
Blood Pressure & Cholesterol - Has high cholesterol level (%)
Consumer Behavior - Money monthly spent on food at supermarket/grocery store
Consumer Behavior - Money monthly spent on food at other stores
Consumer Behavior - Money monthly spent on eating out
Consumer Behavior - Money monthly spent on carryout/delivered foods
Consumer Behavior - Income spent on food at supermarket/grocery store (%)
Consumer Behavior - Income spent on food at other stores (%)
Consumer Behavior - Income spent on eating out (%)
Consumer Behavior - Income spent on carryout/delivered foods (%)
Current Health Status - General health condition (%)
Current Health Status - Blood donors (%)
Current Health Status - Has blood ever tested for HIV virus (%)
Current Health Status - Left-handed people (%)
Dermatology - People using sunscreen (%)
Diabetes - Diabetics (%)
Diabetes - Had a blood test for high blood sugar (%)
Diabetes - People taking insulin (%)
Diet Behavior & Nutrition - Diet health (%)
Diet Behavior & Nutrition - Milk product consumption (# of products/month)
Diet Behavior & Nutrition - Meals not home prepared (#/week)
Diet Behavior & Nutrition - Meals from fast food or pizza place (#/week)
Diet Behavior & Nutrition - Ready-to-eat foods (#/month)
Diet Behavior & Nutrition - Frozen meals/pizza (#/month)
Drug Use - People that ever used marijuana or hashish (%)
Drug Use - Ever used hard drugs (%)
Drug Use - Ever used any form of cocaine (%)
Drug Use - Ever used heroin (%)
Drug Use - Ever used methamphetamine (%)
Health Insurance - People covered by health insurance (%)
Kidney Conditions-Urology - Avg. # of times urinating at night
Medical Conditions - People with asthma (%)
Medical Conditions - People with anemia (%)
Medical Conditions - People with psoriasis (%)
Medical Conditions - People with overweight (%)
Medical Conditions - Elderly people having difficulties in thinking or remembering (%)
Medical Conditions - People who ever received blood transfusion (%)
Medical Conditions - People having trouble seeing even with glass/contacts (%)
Medical Conditions - People with arthritis (%)
Medical Conditions - People with gout (%)
Medical Conditions - People with congestive heart failure (%)
Medical Conditions - People with coronary heart disease (%)
Medical Conditions - People with angina pectoris (%)
Medical Conditions - People who ever had heart attack (%)
Medical Conditions - People who ever had stroke (%)
Medical Conditions - People with emphysema (%)
Medical Conditions - People with thyroid problem (%)
Medical Conditions - People with chronic bronchitis (%)
Medical Conditions - People with any liver condition (%)
Medical Conditions - People who ever had cancer or malignancy (%)
Mental Health - People who have little interest in doing things (%)
Mental Health - People feeling down, depressed, or hopeless (%)
Mental Health - People who have trouble sleeping or sleeping too much (%)
Mental Health - People feeling tired or having little energy (%)
Mental Health - People with poor appetite or overeating (%)
Mental Health - People feeling bad about themself (%)
Mental Health - People who have trouble concentrating on things (%)
Mental Health - People moving or speaking slowly or too fast (%)
Mental Health - People having thoughts they would be better off dead (%)
Oral Health - Average years since last visit a dentist
Oral Health - People embarrassed because of mouth (%)
Oral Health - People with gum disease (%)
Oral Health - General health of teeth and gums (%)
Oral Health - Average days a week using dental floss/device
Oral Health - Average days a week using mouthwash for dental problem
Oral Health - Average number of teeth
Pesticide Use - Households using pesticides to control insects (%)
Pesticide Use - Households using pesticides to kill weeds (%)
Physical Activity - People doing vigorous-intensity work activities (%)
Physical Activity - People doing moderate-intensity work activities (%)
Physical Activity - People walking or bicycling (%)
Physical Activity - People doing vigorous-intensity recreational activities (%)
Physical Activity - People doing moderate-intensity recreational activities (%)
Physical Activity - Average hours a day doing sedentary activities
Physical Activity - Average hours a day watching TV or videos
Physical Activity - Average hours a day using computer
Physical Functioning - People having limitations keeping them from working (%)
Physical Functioning - People limited in amount of work they can do (%)
Physical Functioning - People that need special equipment to walk (%)
Physical Functioning - People experiencing confusion/memory problems (%)
Physical Functioning - People requiring special healthcare equipment (%)
Prescription Medications - Average number of prescription medicines taking
Preventive Aspirin Use - Adults 40+ taking low-dose aspirin (%)
Reproductive Health - Vaginal deliveries (%)
Reproductive Health - Cesarean deliveries (%)
Reproductive Health - Deliveries resulted in a live birth (%)
Reproductive Health - Pregnancies resulted in a delivery (%)
Reproductive Health - Women breastfeeding newborns (%)
Reproductive Health - Women that had a hysterectomy (%)
Reproductive Health - Women that had both ovaries removed (%)
Reproductive Health - Women that have ever taken birth control pills (%)
Reproductive Health - Women taking birth control pills (%)
Reproductive Health - Women that have ever used Depo-Provera or injectables (%)
Reproductive Health - Women that have ever used female hormones (%)
Sexual Behavior - People 18+ that ever had sex (vaginal, anal, or oral) (%)
Sexual Behavior - Males 18+ that ever had vaginal sex with a woman (%)
Sexual Behavior - Males 18+ that ever performed oral sex on a woman (%)
Sexual Behavior - Males 18+ that ever had anal sex with a woman (%)
Sexual Behavior - Males 18+ that ever had any sex with a man (%)
Sexual Behavior - Females 18+ that ever had vaginal sex with a man (%)
Sexual Behavior - Females 18+ that ever performed oral sex on a man (%)
Sexual Behavior - Females 18+ that ever had anal sex with a man (%)
Sexual Behavior - Females 18+ that ever had any kind of sex with a woman (%)
Sexual Behavior - Average age people first had sex
Sexual Behavior - Average number of female sex partners in lifetime (males 18+)
Sexual Behavior - Average number of female vaginal sex partners in lifetime (males 18+)
Sexual Behavior - Average age people first performed oral sex on a woman (18+)
Sexual Behavior - Average number of woman performed oral sex on in lifetime (18+)
Sexual Behavior - Average number of male sex partners in lifetime (males 18+)
Sexual Behavior - Average number of male anal sex partners in lifetime (males 18+)
Sexual Behavior - Average age people first performed oral sex on a man (18+)
Sexual Behavior - Average number of male oral sex partners in lifetime (18+)
Sexual Behavior - People using protection when performing oral sex (%)
Sexual Behavior - Average number of times people have vaginal or anal sex a year
Sexual Behavior - People having sex without condom (%)
Sexual Behavior - Average number of male sex partners in lifetime (females 18+)
Sexual Behavior - Average number of male vaginal sex partners in lifetime (females 18+)
Sexual Behavior - Average number of female sex partners in lifetime (females 18+)
Sexual Behavior - Circumcised males 18+ (%)
Sleep Disorders - Average hours sleeping at night
Sleep Disorders - People that has trouble sleeping (%)
Smoking-Cigarette Use - People smoking cigarettes (%)
Taste & Smell - People 40+ having problems with smell (%)
Taste & Smell - People 40+ having problems with taste (%)
Taste & Smell - People 40+ that ever had wisdom teeth removed (%)
Taste & Smell - People 40+ that ever had tonsils teeth removed (%)
Taste & Smell - People 40+ that ever had a loss of consciousness because of a head injury (%)
Taste & Smell - People 40+ that ever had a broken nose or other serious injury to face or skull (%)
Taste & Smell - People 40+ that ever had two or more sinus infections (%)
Weight - Average height (inches)
Weight - Average weight (pounds)
Weight - Average BMI
Weight - People that are obese (%)
Weight - People that ever were obese (%)
Weight - People trying to lose weight (%)
According to our research of Washington and other state lists, there was 1 registered sex offender living in Covington, Washington as of June 27, 2024 . The ratio of all residents to sex offenders in Covington is 19,821 to 1.The ratio of registered sex offenders to all residents in this city is much lower than the state average.
Officers per 1,000 residents here:
0.91Washington average:
1.35
Latest news from Covington, WA collected exclusively by city-data.com from local newspapers, TV, and radio stations
Ancestries: German (7.8%), Ukrainian (6.9%), English (6.3%), American (5.0%), European (4.6%), Norwegian (3.1%).
Current Local Time:
Land area: 5.77 square miles.
Population density: 3,706 people per square mile (average).
3,623 residents are foreign born (9.1% Asia , 3.6% Europe ).
This city:
17.3%Washington:
14.9%
Median real estate property taxes paid for housing units with mortgages in 2022: $4,828 (0.8%)Median real estate property taxes paid for housing units with no mortgage in 2022: $5,771 (1.0%)
Nearest city with pop. 50,000+: Tahoma-Maple Valley, WA (2.1 miles
Nearest city with pop. 200,000+: East Seattle, WA (17.6 miles
Nearest city with pop. 1,000,000+: Los Angeles, CA
Nearest cities:
Danville, WA (1.8 miles),
Latitude: 47.37 N, Longitude: 122.10 W
Daytime population change due to commuting: -4,508 (-21.5%)Workers who live and work in this city: 2,974 (26.6%)
Area code commonly used in this area: 425
Property values in Covington, WA
Single-family new house construction building permits:
2022: 20 buildings , average cost: $443,9002021: 127 buildings , average cost: $359,1002020: 118 buildings , average cost: $377,9002019: 100 buildings , average cost: $374,9002018: 65 buildings , average cost: $498,6002017: 85 buildings , average cost: $438,9002016: 62 buildings , average cost: $383,3002015: 17 buildings , average cost: $376,3002013: 75 buildings , average cost: $260,5002012: 140 buildings , average cost: $255,9002011: 41 buildings , average cost: $251,5002010: 44 buildings , average cost: $253,6002009: 19 buildings , average cost: $257,8002008: 54 buildings , average cost: $290,7002007: 81 buildings , average cost: $303,4002006: 30 buildings , average cost: $309,2002005: 97 buildings , average cost: $298,2002004: 269 buildings , average cost: $233,6002003: 356 buildings , average cost: $237,1002002: 159 buildings , average cost: $250,5002001: 227 buildings , average cost: $224,1002000: 49 buildings , average cost: $195,6001999: 20 buildings , average cost: $207,0001998: 26 buildings , average cost: $211,1001997: 41 buildings , average cost: $167,800Unemployment in December 2023: Population change in the 1990s: +2,450 (+21.6%).
Most common occupations in Covington, WA (%)
Both Males Females
Other office and administrative support workers, including supervisors (4.8%)
Other management occupations, except farmers and farm managers (4.7%)
Other sales and related occupations, including supervisors (4.6%)
Other production occupations, including supervisors (4.3%)
Computer specialists (3.9%)
Material recording, scheduling, dispatching, and distributing workers (3.8%)
Electrical equipment mechanics and other installation, maintenance, and repair workers, including supervisors (3.5%)
Electrical equipment mechanics and other installation, maintenance, and repair workers, including supervisors (5.9%)
Other production occupations, including supervisors (5.9%)
Computer specialists (5.8%)
Other management occupations, except farmers and farm managers (5.1%)
Other sales and related occupations, including supervisors (4.8%)
Sales representatives, services, wholesale and manufacturing (4.2%)
Driver/sales workers and truck drivers (3.9%)
Other office and administrative support workers, including supervisors (8.4%)
Secretaries and administrative assistants (4.9%)
Other sales and related occupations, including supervisors (4.4%)
Information and record clerks, except customer service representatives (4.4%)
Other management occupations, except farmers and farm managers (4.2%)
Material recording, scheduling, dispatching, and distributing workers (4.2%)
Preschool, kindergarten, elementary, and middle school teachers (4.0%)
Earthquake activity:
Covington-area historical earthquake activity is significantly above Washington state average. It is 1361% greater than the overall U.S. average. On 4/13/1949 at 19:55:42, a magnitude 7.0 (7.0 UK, Class: Major, Intensity: VIII - XII) earthquake occurred 20.4 miles away from Covington center, causing $80,000,000 total damage On 2/28/2001 at 18:54:32, a magnitude 6.8 (6.5 MB, 6.6 MS, 6.8 MW, Class: Strong, Intensity: VII - IX) earthquake occurred 29.5 miles away from the city center, causing $2,000,000,000 total damage and $305,000,000 insured lossesOn 2/28/2001 at 18:54:32, a magnitude 6.8 (6.8 MD, Depth: 32.2 mi) earthquake occurred 33.0 miles away from Covington center On 4/29/1965 at 15:28:43, a magnitude 6.6 (6.6 UK) earthquake occurred 11.4 miles away from Covington center, causing $28,000,000 total damage On 7/3/1999 at 01:43:54, a magnitude 5.8 (5.4 MB, 5.5 MS, 5.8 MW, 5.3 ME, Depth: 25.2 mi, Class: Moderate, Intensity: VI - VII) earthquake occurred 57.3 miles away from Covington center On 5/3/1996 at 04:04:22, a magnitude 5.5 (5.2 MB, 5.3 MD, 5.5 ML, Depth: 2.5 mi) earthquake occurred 36.4 miles away from the city center Magnitude types: body-wave magnitude (MB), duration magnitude (MD), energy magnitude (ME), local magnitude (ML), surface-wave magnitude (MS), moment magnitude (MW) Natural disasters: The number of natural disasters in King County (30) is a lot greater than the US average (15).Major Disasters (Presidential) Declared: 27Emergencies Declared: 1Floods: 21, Storms: 16, Mudslides: 11, Landslides: 9, Winter Storms: 7, Earthquakes: 2, Heavy Rains: 2, Winds: 2, Hurricane: 1, Snow: 1, Volcanic Eruption: 1, Other: 1 (Note: some incidents may be assigned to more than one category). Hospitals and medical centers near Covington: BENSON HEIGHTS REHABILITATION CENTER (Nursing Home, about 6 miles away; KENT, WA)
GREEN RIVER TERRACE NURSING CENTER (Nursing Home, about 7 miles away; AUBURN, WA)
NORTH AUBURN REHAB AND HEALTH CENTER (Nursing Home, about 7 miles away; AUBURN, WA)
KENT COMMUNITY DIALYSIS CENTER (Dialysis Facility, about 7 miles away; KENT, WA)
NKC KENT KIDNEY CENTER (Dialysis Facility, about 7 miles away; KENT, WA)
VALLEY MEDICAL CENTER (about 8 miles away; RENTON, WA)
TALBOT CENTER FOR REHAB AND HEAL (Nursing Home, about 8 miles away; RENTON, WA)
Heliports located in Covington: Amtrak stations near Covington: 18 miles: TACOMA (1001 PUYALLUP AVE.) Services: ticket office, partially wheelchair accessible, enclosed waiting area, public restrooms, public payphones, full-service food facilities, free short-term parking, free long-term parking, call for taxi service, intercity bus service, public transit connection.
20 miles: SEATTLE (303 S. JACKSON ST.) Services: ticket office, fully wheelchair accessible, enclosed waiting area, public restrooms, public payphones, vending machines, paid short-term parking, paid long-term parking, call for car rental service, taxi stand, intercity bus service, public transit connection.
Colleges/universities with over 2000 students nearest to Covington:
Green River Community College (about 6 miles; Auburn, WA ; Full-time enrollment: 7,425)
Renton Technical College (about 10 miles; Renton, WA ; FT enrollment: 2,549)
Highline Community College (about 10 miles; Des Moines, WA ; FT enrollment: 6,074)
Bellevue College (about 16 miles; Bellevue, WA ; FT enrollment: 10,940)
Pierce College at Puyallup (about 17 miles; Puyallup, WA ; FT enrollment: 2,529)
Seattle Community College-South Campus (about 18 miles; Seattle, WA ; FT enrollment: 3,986)
University of Washington-Tacoma Campus (about 18 miles; Tacoma, WA ; FT enrollment: 3,788)
Public high schools in Covington: KENTWOOD HIGH SCHOOL Location: 25800 164TH AVE SE, Grades: 9-12)TAHOMA SENIOR HIGH SCHOOL Location: 18200 SE 240TH STREET, Grades: 10-12)
Private high school in Covington: KENTWOOD CHRISTIAN ACADEMY Students: 7, Location: 26223 164TH AVE SE, Grades: 8-12)
Public elementary/middle schools in Covington:
See full list of schools located in Covington User-submitted facts and corrections:
Medical Center in Covington= MultiCare
Churches in Covington include: (A) , Covington Community Church (B) , Cornerstone United Methodist Church (C) , Saint John the Baptist Church (D) , Kentwood Family Church (E) , Kingdom Hall of Jehovahs Witnesses (F) , Spirit and Truth Foursquare Church (G) , The Church of Jesus Christ of Latter Day Saints (H) . Display/hide their locations on the map
Birthplace of: Mike Jensen - College basketball player (Washington Huskies).
King County has a predicted average indoor radon screening level less than 2 pCi/L (pico curies per liter) - Low Potential Average household size: This city:
3.0 peopleWashington:
2.5 people
Percentage of family households: This city:
79.9%Whole state:
64.4%
Percentage of households with unmarried partners: This city:
7.5%Whole state:
7.7%
Likely homosexual households (counted as self-reported same-sex unmarried-partner households)
Lesbian couples: 0.5% of all households Gay men: 0.2% of all households
30 people in group homes intended for adults in 2010
Banks with branches in Covington (2011 data):
Bank of America, National Association: Covington Branch at 27103 185th Avenue Se, branch established on 1995/04/05. Info updated 2009/11/18: Bank assets: $1,451,969.3 mil, Deposits: $1,077,176.8 mil, headquarters in Charlotte, NC, positive income , 5782 total offices , Holding Company: Bank Of America Corporation
U.S. Bank National Association: Covington Branch at 17601 Se 272nd Street, branch established on 1982/08/02. Info updated 2012/01/30: Bank assets: $330,470.8 mil, Deposits: $236,091.5 mil, headquarters in Cincinnati, OH, positive income , 3121 total offices , Holding Company: U.S. Bancorp
For population 15 years and over in Covington:
Never married: 27.0%Now married: 56.8%Separated: 0.2%Widowed: 3.6%Divorced: 12.4% For population 25 years and over in Covington:
High school or higher: 94.4%Bachelor's degree or higher: 33.6%Graduate or professional degree: 10.4%Unemployed: 4.6%Mean travel time to work (commute): 26.0 minutes
Education Gini index (Inequality in education) Here:
9.2Washington average:
11.6
Religion statistics for Covington, WA (based on King County data)
Religion Adherents Congregations Catholic 278,340 71 Evangelical Protestant 204,523 711 Other 119,713 329 Mainline Protestant 104,806 304 Orthodox 12,257 20 Black Protestant 7,030 24 None 1,204,580 -
Source: Clifford Grammich, Kirk Hadaway, Richard Houseal, Dale E.Jones, Alexei Krindatch, Richie Stanley and Richard H.Taylor. 2012. 2010 U.S.Religion Census: Religious Congregations & Membership Study. Association of Statisticians of American Religious Bodies. Jones, Dale E., et al. 2002. Congregations and Membership in the United States 2000. Nashville, TN: Glenmary Research Center. Graphs represent county-level data
Food Environment Statistics: Number of grocery stores : 439King County :
2.37 / 10,000 pop.State :
2.06 / 10,000 pop.
Number of supercenters and club stores : 29King County :
0.16 / 10,000 pop.Washington :
0.19 / 10,000 pop.
Number of convenience stores (no gas) : 220King County :
1.19 / 10,000 pop.Washington :
1.18 / 10,000 pop.
Number of convenience stores (with gas) : 399King County :
2.16 / 10,000 pop.State :
2.67 / 10,000 pop.
Number of full-service restaurants : 2,027Here :
10.95 / 10,000 pop.Washington :
8.26 / 10,000 pop.
Adult diabetes rate : King County :
6.7%Washington :
7.7%
Adult obesity rate : King County :
20.5%Washington :
25.7%
Low-income preschool obesity rate : King County :
14.6%State :
13.9%
Health and Nutrition: Healthy diet rate : Covington:
48.9%Washington:
49.9%
Average overall health of teeth and gums : This city:
47.0%Washington:
47.2%
Average BMI : Covington:
28.6Washington:
28.4
People feeling badly about themselves : Covington:
21.9%State:
20.9%
People not drinking alcohol at all : Covington:
9.0%Washington:
10.5%
Average hours sleeping at night : Overweight people : Here:
33.5%Washington:
32.8%
General health condition : This city:
57.5%Washington:
56.8%
Average condition of hearing : This city:
81.1%Washington:
79.4%
More about Health and Nutrition of Covington, WA Residents
Local government employment and payroll (March 2022)
Function
Full-time employees
Monthly full-time payroll
Average yearly full-time wage
Part-time employees
Monthly part-time payroll
Other Government Administration
23 $209,816 $109,469 9 $16,668 Parks and Recreation
11 $71,607 $78,117 50 $26,515 Streets and Highways
11 $81,486 $88,894 0 $0 Financial Administration
3 $30,775 $123,100 4 $19,265 Judicial and Legal
1 $13,720 $164,640 0 $0
Totals for Government
49 $407,403 $99,772 63 $62,448
Covington government finances - Expenditure in 2017 (per resident):
Construction - Parks and Recreation: $1,881,000 ($88.00)
Regular Highways: $1,220,000 ($57.08)Current Operations - Parks and Recreation: $1,877,000 ($87.82)
Sewerage: $1,877,000 ($87.82)Central Staff Services: $1,636,000 ($76.54)Housing and Community Development: $1,153,000 ($53.94)Regular Highways: $1,067,000 ($49.92)Financial Administration: $1,000,000 ($46.79)General - Other: $445,000 ($20.82)Judicial and Legal Services: $241,000 ($11.28)General Public Buildings: $124,000 ($5.80)Solid Waste Management: $113,000 ($5.29)Protective Inspection and Regulation - Other: $53,000 ($2.48)Health - Other: $23,000 ($1.08)Police Protection: $18,000 ($0.84)General - Interest on Debt: $467,000 ($21.85)
Intergovernmental to Local - Other - Police Protection: $3,771,000 ($176.43)
Other - Judicial and Legal Services: $176,000 ($8.23)Other - Correctional Institutions: $155,000 ($7.25)Other - Regular Highways: $76,000 ($3.56)Other - Sewerage: $71,000 ($3.32)Other - Protective Inspection and Regulations: $57,000 ($2.67)Other - Local Fire Protection: $55,000 ($2.57)Other - General - Other: $47,000 ($2.20)Other - Financial Administration: $45,000 ($2.11)Other - Health - Other: $40,000 ($1.87)Other - Parks and Recreation: $7,000 ($0.33)Other - Central Staff Services: $1,000 ($0.05)Other Capital Outlay - General - Other: $14,000 ($0.66)
Parks and Recreation: $12,000 ($0.56)Regular Highways: $5,000 ($0.23)Total Salaries and Wages: $4,118,000 ($192.66)
Covington government finances - Revenue in 2017 (per resident):
Charges - Sewerage: $2,086,000 ($97.60)
Other: $1,770,000 ($82.81)Parks and Recreation: $942,000 ($44.07)Federal Intergovernmental - Other: $83,000 ($3.88)
Natural Resources: $25,000 ($1.17)Local Intergovernmental - Other: $66,000 ($3.09)
Miscellaneous - Rents: $148,000 ($6.92)
Special Assessments: $139,000 ($6.50)Fines and Forfeits: $102,000 ($4.77)General Revenue - Other: $100,000 ($4.68)Donations From Private Sources: $35,000 ($1.64)Sale of Property: $3,000 ($0.14)Interest Earnings: $0 ($0.00)State Intergovernmental - Other: $1,012,000 ($47.35)
Highways: $431,000 ($20.16)General Local Government Support: $247,000 ($11.56)Housing and Community Development: $33,000 ($1.54)Education: $4,000 ($0.19)Tax - General Sales and Gross Receipts: $4,985,000 ($233.23)
Property: $2,551,000 ($119.35)Public Utilities Sales: $2,484,000 ($116.22)Other License: $1,709,000 ($79.96)Documentary and Stock Transfer: $829,000 ($38.79)Motor Vehicle License: $142,000 ($6.64)Occupation and Business License - Other: $93,000 ($4.35)
Covington government finances - Debt in 2017 (per resident):
Long Term Debt - Beginning Outstanding - Unspecified Public Purpose: $11,681,000 ($546.51)
Outstanding Unspecified Public Purpose: $10,434,000 ($488.16)Retired Unspecified Public Purpose: $9,346,000 ($437.26)Issue, Unspecified Public Purpose: $8,100,000 ($378.97)
6.69% of this county's 2021 resident taxpayers lived in other counties in 2020 ($106,002 average adjusted gross income )
Here:
6.69%Washington average:
7.53%
0.02% of residents moved from foreign countries ($181 average AGI )King County:
0.02%Washington average:
0.05%
Top counties from which taxpayers relocated into this county between 2020 and 2021:
7.71% of this county's 2020 resident taxpayers moved to other counties in 2021 ($123,052 average adjusted gross income )
Here:
7.71%Washington average:
7.40%
0.01% of residents moved to foreign countries ($183 average AGI )King County:
0.01%Washington average:
0.04%
Top counties to which taxpayers relocated from this county between 2020 and 2021:
Businesses in Covington, WA
Name Count Name Count
AutoZone 1 Office Depot 1 Carl\s Jr. 1 Panda Express 1 Cold Stone Creamery 1 Payless 1 Costco 1 Pier 1 Imports 1 FedEx 2 Quiznos 1 GNC 1 Red Robin 1 GameStop 1 Rite Aid 1 H&R Block 1 Sprint Nextel 1 Home Depot 1 Starbucks 2 IHOP 1 T-Mobile 3 Jamba Juice 1 Taco Bell 1 KFC 1 U-Haul 1 Kohl's 1 UPS 4 Kroger 2 Verizon Wireless 2 LA Fitness 1 Vons 1 McDonald's 1 Walgreens 1 Nike 2 Walmart 1
Strongest AM radio stations in Covington:
KNWX (1210 AM; 28 kW; AUBURN-FEDERAL WAY, WA; Owner: ENTERCOM SEATTLE LICENSE, LLC)
KIRO (710 AM; 50 kW; SEATTLE, WA; Owner: ENTERCOM SEATTLE LICENSE, LLC)
KTTH (770 AM; 50 kW; SEATTLE, WA; Owner: ENTERCOM SEATTLE LICENSE, LLC)
KIXI (880 AM; 50 kW; MERCER ISLAND/SEATTL, WA; Owner: BELLEVUE RADIO, INC.)
KYCW (1090 AM; 50 kW; SEATTLE, WA; Owner: INFINITY RADIO SUBSIDIARY OPERATIONS INC.)
KJR (950 AM; 50 kW; SEATTLE, WA)
KGNW (820 AM; 50 kW; BURIEN-SEATTLE, WA; Owner: INSPIRATION MEDIA, INC.)
KOMO (1000 AM; 50 kW; SEATTLE, WA; Owner: FISHER BROADCASTING - SEATTLE RADIO, L.L.C.)
KRIZ (1420 AM; 10 kW; RENTON, WA; Owner: KRIZ BROADCASTING, INC.)
KYIZ (1620 AM; 10 kW; RENTON, WA; Owner: KRIZ BROADCASTING, INC.)
KKOL (1300 AM; 50 kW; SEATTLE, WA; Owner: INSPIRATION MEDIA, INC.)
KHHO (850 AM; 10 kW; TACOMA, WA; Owner: ACKERLEY MEDIA GROUP, INC.)
KKNW (1150 AM; 10 kW; SEATTLE, WA; Owner: ORCA RADIO, INC.)
Strongest FM radio stations in Covington:
KBSG-FM (97.3 FM; TACOMA, WA; Owner: ENTERCOM SEATTLE LICENSE, LLC)
KBKS (106.1 FM; TACOMA, WA; Owner: INFINITY RADIO SUBSIDIARY OPERATIONS INC.)
KING-FM (98.1 FM; SEATTLE, WA; Owner: CLASSIC RADIO, INC.)
KLSY-FM (92.5 FM; BELLEVUE, WA; Owner: BELLEVUE RADIO INC.)
KPLU-FM (88.5 FM; TACOMA, WA; Owner: PACIFIC LUTHERAN UNIVERSITY, INC.)
KWJZ (98.9 FM; SEATTLE, WA; Owner: ORCA RADIO, INC.)
KZOK-FM (102.5 FM; SEATTLE, WA; Owner: INFINITY RADIO SUBSIDIARY OPERATIONS INC.)
KMPS-FM (94.1 FM; SEATTLE, WA; Owner: INFINITY RADIO SUBSIDIARY OPERATIONS INC.)
KMTT (103.7 FM; TACOMA, WA; Owner: ENTERCOM SEATTLE LICENSE, LLC)
KNDD (107.7 FM; SEATTLE, WA; Owner: ENTERCOM SEATTLE LICENSE, LLC)
KYPT (96.5 FM; SEATTLE, WA; Owner: INFINITY RADIO SUBSIDIARY OPERATIONS INC.)
K201EX (88.1 FM; GREENWATER, WA; Owner: CALVARY CHAPEL OF TWIN FALLS, INC.)
KJR-FM (95.7 FM; SEATTLE, WA; Owner: ACKERLEY MEDIA GROUP, INC.)
KUBE (93.3 FM; SEATTLE, WA; Owner: ACKERLEY MEDIA GROUP, INC.)
KPLZ-FM (101.5 FM; SEATTLE, WA; Owner: FISHER BROADCASTING - SEATTLE RADIO, L.L.C.)
KNHC (89.5 FM; SEATTLE, WA; Owner: SEATTLE PUBLIC SCHOOLS)
KQBZ (100.7 FM; SEATTLE, WA; Owner: ENTERCOM SEATTLE LICENSE, LLC)
KISW (99.9 FM; SEATTLE, WA; Owner: ENTERCOM SEATTLE LICENSE, LLC)
KRWM (106.9 FM; BREMERTON, WA; Owner: SEASCAPE RADIO, INC.)
KGRG (89.9 FM; AUBURN, WA; Owner: GREEN RIVER COMMUNITY COLLEGE)
TV broadcast stations around Covington:
KHCV (Channel 45; SEATTLE, WA; Owner: NORTH PACIFIC INTERNATIONAL TELEVISION, INC.)
KWPX (Channel 33; BELLEVUE, WA; Owner: PAXSON COMMUNICATIONS LICENSE COMPANY, LLC)
KWDK (Channel 56; TACOMA, WA; Owner: PUGET SOUND EDUCATIONAL TV, INC.)
KSTW (Channel 11; TACOMA, WA; Owner: UPN TELEVISION STATIONS INC.)
KING-TV (Channel 5; SEATTLE, WA; Owner: KING BROADCASTING COMPANY)
K58DP (Channel 58; SEATTLE, WA; Owner: WORD OF GOD FELLOWSHIP, INC.)
KTWB-TV (Channel 22; SEATTLE, WA; Owner: TRIBUNE TELEVISION HOLDINGS, INC.)
KOMO-TV (Channel 4; SEATTLE, WA; Owner: FISHER BROADCASTING - SEATTLE TV, L.L.C.)
KCTS-TV (Channel 9; SEATTLE, WA; Owner: KCTS TELEVISION)
KWOG (Channel 51; BELLEVUE, WA; Owner: AFRICAN-AMERICAN BROADCASTING CO.OF BELLEVUE, INC.)
KIRO-TV (Channel 7; SEATTLE, WA; Owner: KIRO-TV HOLDINGS, INC.)
K57HB (Channel 57; EUREKA, CA; Owner: MS COMMUNICATIONS, LLC)
KBTC-TV (Channel 28; TACOMA, WA; Owner: BATES TECHNICAL COLLEGE)
KONG-TV (Channel 16; EVERETT, WA; Owner: KONG-TV, INC.)
KCPQ (Channel 13; TACOMA, WA; Owner: TRIBUNE TELEVISION NORTHWEST, INC.)
K68DL (Channel 68; SEATTLE, WA; Owner: THREE ANGELS BROADCASTING NETWORK)
National Bridge Inventory (NBI) Statistics 19 Number of bridges210ft / 64.3m Total length $41,883,000 Total costs325,096 Total average daily traffic33,789 Total average daily truck traffic
New bridges - historical statistics
1 1920-1929 2 1970-1979 2 1980-1989 5 1990-1999 9 2000-2009
See full National Bridge Inventory statistics for Covington, WA
FCC Registered Antenna Towers: 14 (
See the full list of FCC Registered Antenna Towers in Covington )
FCC Registered Broadcast Land Mobile Towers: 9 (
See the full list of FCC Registered Broadcast Land Mobile Towers in Covington, WA )
FCC Registered Microwave Towers: 1
COVINGTON WA, 23843 178th Place Se (Lat: 47.388444 Lon: -122.103722), Type: Tower, Structure height: 45.7 m, Overall height: 49.4 m, Call Sign: WQIK734, Assigned Frequencies: 11525.0 MHz, 6063.80 MHz, Grant Date: 03/05/2008, Expiration Date: 03/05/2018, Cancellation Date: 09/05/2009, Certifier: William Chastain, Registrant: Radio Dynamics Corporation, 774 Mays Blvd., #10-465, Silver Spring, MD 20914, Phone: (301) 493-5171, Fax: (301) 576-4553, Email:
FCC Registered Amateur Radio Licenses: 149 (
See the full list of FCC Registered Amateur Radio Licenses in Covington )
FAA Registered Aircraft: 16 (
See the full list of FAA Registered Aircraft in Covington )
Home Mortgage Disclosure Act Aggregated Statistics For Year 2009(Based on 5 partial tracts) A) FHA, FSA/RHS & VA B) Conventional C) Refinancings D) Home Improvement Loans F) Non-occupant Loans on G) Loans On Manufactured Number Average Value Number Average Value Number Average Value Number Average Value Number Average Value Number Average Value
LOANS ORIGINATED 131 $254,406 72 $226,912 572 $241,866 9 $155,197 24 $188,360 11 $157,845 APPLICATIONS APPROVED, NOT ACCEPTED 9 $260,497 6 $228,183 71 $251,224 5 $160,320 2 $236,175 1 $79,170 APPLICATIONS DENIED 24 $257,948 10 $218,594 196 $258,926 13 $136,356 9 $203,961 6 $149,815 APPLICATIONS WITHDRAWN 13 $225,002 7 $235,066 128 $263,231 0 $0 8 $236,172 0 $0 FILES CLOSED FOR INCOMPLETENESS 2 $287,600 0 $0 20 $264,921 1 $54,350 1 $54,350 0 $0
Aggregated Statistics For Year 2008(Based on 5 partial tracts) A) FHA, FSA/RHS & VA B) Conventional C) Refinancings D) Home Improvement Loans F) Non-occupant Loans on G) Loans On Manufactured Number Average Value Number Average Value Number Average Value Number Average Value Number Average Value Number Average Value
LOANS ORIGINATED 70 $300,417 101 $270,777 327 $258,863 25 $102,308 29 $234,588 5 $179,406 APPLICATIONS APPROVED, NOT ACCEPTED 5 $311,968 17 $287,564 78 $275,185 6 $75,272 3 $270,443 1 $148,100 APPLICATIONS DENIED 20 $294,542 30 $292,211 225 $275,967 50 $121,008 12 $260,961 8 $176,066 APPLICATIONS WITHDRAWN 10 $288,071 15 $342,243 120 $263,557 8 $158,795 8 $246,710 2 $133,635 FILES CLOSED FOR INCOMPLETENESS 2 $335,525 4 $184,275 30 $279,785 4 $115,145 3 $149,703 0 $0
Aggregated Statistics For Year 2007(Based on 5 partial tracts) A) FHA, FSA/RHS & VA B) Conventional C) Refinancings D) Home Improvement Loans E) Loans on Dwellings For 5+ Families F) Non-occupant Loans on G) Loans On Manufactured Number Average Value Number Average Value Number Average Value Number Average Value Number Average Value Number Average Value Number Average Value
LOANS ORIGINATED 20 $282,583 320 $252,764 516 $233,493 52 $123,676 2 $3,872,295 64 $231,132 11 $180,855 APPLICATIONS APPROVED, NOT ACCEPTED 3 $221,393 51 $232,536 97 $224,417 13 $84,135 0 $0 14 $206,831 3 $140,933 APPLICATIONS DENIED 4 $238,930 94 $231,090 258 $254,458 49 $133,162 0 $0 20 $248,752 12 $140,717 APPLICATIONS WITHDRAWN 1 $388,040 32 $221,413 112 $250,099 14 $191,864 0 $0 10 $228,194 2 $69,650 FILES CLOSED FOR INCOMPLETENESS 0 $0 12 $303,396 46 $254,070 5 $68,556 0 $0 5 $317,548 1 $83,580
Aggregated Statistics For Year 2006(Based on 5 partial tracts) A) FHA, FSA/RHS & VA B) Conventional C) Refinancings D) Home Improvement Loans F) Non-occupant Loans on G) Loans On Manufactured Number Average Value Number Average Value Number Average Value Number Average Value Number Average Value Number Average Value
LOANS ORIGINATED 15 $249,905 501 $197,556 649 $206,903 59 $126,479 88 $173,567 11 $165,725 APPLICATIONS APPROVED, NOT ACCEPTED 1 $186,360 87 $190,524 111 $199,635 10 $129,870 9 $198,749 2 $129,095 APPLICATIONS DENIED 2 $158,835 148 $218,650 320 $215,283 48 $139,684 33 $212,989 9 $131,134 APPLICATIONS WITHDRAWN 2 $264,455 70 $192,876 216 $218,175 18 $169,211 16 $250,497 2 $173,240 FILES CLOSED FOR INCOMPLETENESS 1 $265,530 19 $194,934 58 $240,989 1 $27,170 2 $180,980 1 $274,260
Aggregated Statistics For Year 2005(Based on 5 partial tracts) A) FHA, FSA/RHS & VA B) Conventional C) Refinancings D) Home Improvement Loans F) Non-occupant Loans on G) Loans On Manufactured Number Average Value Number Average Value Number Average Value Number Average Value Number Average Value Number Average Value
LOANS ORIGINATED 20 $226,442 658 $181,824 693 $183,394 62 $88,090 105 $170,489 13 $122,482 APPLICATIONS APPROVED, NOT ACCEPTED 2 $194,250 95 $188,233 109 $175,306 10 $46,199 19 $212,525 6 $75,592 APPLICATIONS DENIED 3 $201,517 143 $191,901 348 $189,350 40 $86,005 23 $199,561 16 $96,819 APPLICATIONS WITHDRAWN 1 $228,300 78 $181,031 268 $204,138 24 $159,067 18 $215,139 5 $82,838 FILES CLOSED FOR INCOMPLETENESS 0 $0 12 $207,182 58 $213,278 5 $87,544 2 $158,050 0 $0
Aggregated Statistics For Year 2004(Based on 5 partial tracts) A) FHA, FSA/RHS & VA B) Conventional C) Refinancings D) Home Improvement Loans F) Non-occupant Loans on G) Loans On Manufactured Number Average Value Number Average Value Number Average Value Number Average Value Number Average Value Number Average Value
LOANS ORIGINATED 56 $210,738 659 $168,246 559 $174,216 30 $68,738 71 $155,815 9 $122,656 APPLICATIONS APPROVED, NOT ACCEPTED 3 $201,207 62 $163,924 115 $168,996 5 $95,242 11 $145,297 2 $114,810 APPLICATIONS DENIED 7 $239,696 92 $152,412 281 $176,537 31 $57,197 18 $158,447 7 $113,107 APPLICATIONS WITHDRAWN 6 $184,178 83 $178,302 239 $182,428 11 $64,066 18 $168,982 3 $120,863 FILES CLOSED FOR INCOMPLETENESS 2 $236,185 14 $154,459 37 $173,969 3 $66,517 3 $172,420 1 $133,390
Aggregated Statistics For Year 2003(Based on 5 partial tracts) A) FHA, FSA/RHS & VA B) Conventional C) Refinancings D) Home Improvement Loans F) Non-occupant Loans on Number Average Value Number Average Value Number Average Value Number Average Value Number Average Value
LOANS ORIGINATED 89 $190,939 428 $174,992 1,242 $164,511 34 $44,498 74 $129,635 APPLICATIONS APPROVED, NOT ACCEPTED 4 $205,678 48 $164,398 155 $159,786 10 $65,687 8 $145,422 APPLICATIONS DENIED 9 $161,960 50 $140,950 287 $164,762 30 $40,626 13 $135,909 APPLICATIONS WITHDRAWN 5 $195,452 42 $177,209 196 $165,959 6 $24,593 12 $166,312 FILES CLOSED FOR INCOMPLETENESS 2 $151,600 15 $169,752 36 $178,338 3 $25,717 0 $0
Aggregated Statistics For Year 2002(Based on 2 partial tracts) A) FHA, FSA/RHS & VA B) Conventional C) Refinancings D) Home Improvement Loans F) Non-occupant Loans on Number Average Value Number Average Value Number Average Value Number Average Value Number Average Value
LOANS ORIGINATED 84 $180,939 288 $167,643 694 $152,321 24 $33,680 55 $120,569 APPLICATIONS APPROVED, NOT ACCEPTED 4 $173,170 33 $177,059 88 $146,964 10 $18,436 5 $160,684 APPLICATIONS DENIED 2 $182,195 29 $124,318 181 $146,369 14 $24,154 12 $133,927 APPLICATIONS WITHDRAWN 4 $197,425 29 $183,815 118 $165,744 5 $34,860 3 $109,163 FILES CLOSED FOR INCOMPLETENESS 1 $124,220 10 $117,286 67 $158,140 1 $29,020 2 $87,930
Aggregated Statistics For Year 2001(Based on 2 partial tracts) A) FHA, FSA/RHS & VA B) Conventional C) Refinancings D) Home Improvement Loans F) Non-occupant Loans on Number Average Value Number Average Value Number Average Value Number Average Value Number Average Value
LOANS ORIGINATED 88 $169,362 202 $155,798 515 $141,969 39 $26,400 39 $121,245 APPLICATIONS APPROVED, NOT ACCEPTED 2 $142,490 17 $135,438 70 $137,322 11 $16,715 3 $132,730 APPLICATIONS DENIED 4 $140,648 28 $92,358 198 $132,212 39 $19,604 7 $130,469 APPLICATIONS WITHDRAWN 5 $173,450 24 $139,358 112 $155,869 9 $23,579 3 $139,377 FILES CLOSED FOR INCOMPLETENESS 1 $104,470 4 $115,188 31 $122,048 2 $17,830 1 $244,300
Aggregated Statistics For Year 2000(Based on 2 partial tracts) A) FHA, FSA/RHS & VA B) Conventional C) Refinancings D) Home Improvement Loans E) Loans on Dwellings For 5+ Families F) Non-occupant Loans on Number Average Value Number Average Value Number Average Value Number Average Value Number Average Value Number Average Value
LOANS ORIGINATED 69 $154,147 153 $142,234 133 $113,160 43 $23,798 1 $100,930 15 $74,613 APPLICATIONS APPROVED, NOT ACCEPTED 3 $155,267 18 $133,707 44 $114,556 11 $23,999 0 $0 5 $118,468 APPLICATIONS DENIED 9 $139,953 36 $117,541 105 $99,810 33 $19,806 1 $84,630 6 $89,913 APPLICATIONS WITHDRAWN 6 $169,602 20 $149,976 50 $109,953 5 $53,290 0 $0 3 $236,230 FILES CLOSED FOR INCOMPLETENESS 0 $0 2 $108,545 20 $119,358 2 $20,895 0 $0 0 $0
Aggregated Statistics For Year 1999(Based on 3 partial tracts) A) FHA, FSA/RHS & VA B) Conventional C) Refinancings D) Home Improvement Loans E) Loans on Dwellings For 5+ Families F) Non-occupant Loans on Number Average Value Number Average Value Number Average Value Number Average Value Number Average Value Number Average Value
LOANS ORIGINATED 99 $142,511 213 $144,952 339 $121,606 74 $26,734 0 $0 27 $98,109 APPLICATIONS APPROVED, NOT ACCEPTED 3 $131,390 24 $130,977 66 $121,187 17 $20,441 1 $78,810 4 $187,642 APPLICATIONS DENIED 10 $148,401 54 $98,774 117 $125,984 41 $31,828 0 $0 7 $92,736 APPLICATIONS WITHDRAWN 5 $145,786 31 $131,145 84 $120,260 6 $83,087 1 $137,560 5 $109,608 FILES CLOSED FOR INCOMPLETENESS 3 $149,637 5 $122,844 41 $113,150 0 $0 0 $0 2 $75,030
Detailed HMDA statistics for the following Tracts:
0317.02
, 0317.03 , 0317.04 , 0320.05 , 0320.07
Private Mortgage Insurance Companies Aggregated Statistics For Year 2009(Based on 5 partial tracts) A) Conventional B) Refinancings D) Loans On Manufactured Number Average Value Number Average Value Number Average Value
LOANS ORIGINATED 10 $264,336 15 $297,043 0 $0 APPLICATIONS APPROVED, NOT ACCEPTED 4 $288,442 7 $295,250 1 $132,330 APPLICATIONS DENIED 2 $247,140 2 $361,865 0 $0 APPLICATIONS WITHDRAWN 1 $144,520 2 $236,910 0 $0 FILES CLOSED FOR INCOMPLETENESS 0 $0 2 $261,545 0 $0
Aggregated Statistics For Year 2008(Based on 5 partial tracts) A) Conventional B) Refinancings C) Non-occupant Loans on D) Loans On Manufactured Number Average Value Number Average Value Number Average Value Number Average Value
LOANS ORIGINATED 44 $305,170 41 $306,861 3 $272,477 0 $0 APPLICATIONS APPROVED, NOT ACCEPTED 12 $286,795 22 $318,391 2 $367,185 1 $99,400 APPLICATIONS DENIED 5 $306,540 2 $403,510 1 $364,690 0 $0 APPLICATIONS WITHDRAWN 2 $343,530 2 $384,820 0 $0 0 $0 FILES CLOSED FOR INCOMPLETENESS 1 $173,540 2 $283,910 1 $143,360 0 $0
Aggregated Statistics For Year 2007(Based on 5 partial tracts) A) Conventional B) Refinancings C) Non-occupant Loans on Number Average Value Number Average Value Number Average Value
LOANS ORIGINATED 72 $299,143 40 $310,938 5 $245,472 APPLICATIONS APPROVED, NOT ACCEPTED 7 $282,349 14 $306,541 3 $241,740 APPLICATIONS DENIED 0 $0 0 $0 0 $0 APPLICATIONS WITHDRAWN 7 $317,657 2 $322,085 1 $373,970 FILES CLOSED FOR INCOMPLETENESS 2 $248,835 1 $333,340 0 $0
Aggregated Statistics For Year 2006(Based on 5 partial tracts) A) Conventional B) Refinancings C) Non-occupant Loans on D) Loans On Manufactured Number Average Value Number Average Value Number Average Value Number Average Value
LOANS ORIGINATED 22 $277,775 20 $276,328 1 $180,500 1 $204,260 APPLICATIONS APPROVED, NOT ACCEPTED 4 $260,967 6 $248,225 2 $261,260 0 $0 APPLICATIONS DENIED 0 $0 0 $0 0 $0 0 $0 APPLICATIONS WITHDRAWN 3 $249,983 3 $276,307 1 $136,390 0 $0 FILES CLOSED FOR INCOMPLETENESS 0 $0 0 $0 0 $0 0 $0
Aggregated Statistics For Year 2005(Based on 5 partial tracts) A) Conventional B) Refinancings C) Non-occupant Loans on Number Average Value Number Average Value Number Average Value
LOANS ORIGINATED 27 $243,157 33 $231,292 2 $217,105 APPLICATIONS APPROVED, NOT ACCEPTED 7 $257,897 7 $202,877 2 $273,295 APPLICATIONS DENIED 0 $0 1 $146,740 0 $0 APPLICATIONS WITHDRAWN 1 $107,370 4 $225,712 0 $0 FILES CLOSED FOR INCOMPLETENESS 0 $0 1 $91,700 0 $0
Aggregated Statistics For Year 2004(Based on 5 partial tracts) A) Conventional B) Refinancings C) Non-occupant Loans on Number Average Value Number Average Value Number Average Value
LOANS ORIGINATED 59 $228,165 43 $215,684 7 $177,751 APPLICATIONS APPROVED, NOT ACCEPTED 16 $237,423 16 $217,552 3 $189,397 APPLICATIONS DENIED 1 $308,470 1 $260,670 0 $0 APPLICATIONS WITHDRAWN 3 $195,073 5 $225,268 0 $0 FILES CLOSED FOR INCOMPLETENESS 1 $203,420 1 $112,600 1 $203,420
Aggregated Statistics For Year 2003(Based on 5 partial tracts) A) Conventional B) Refinancings C) Non-occupant Loans on Number Average Value Number Average Value Number Average Value
LOANS ORIGINATED 88 $218,149 105 $197,860 4 $177,665 APPLICATIONS APPROVED, NOT ACCEPTED 9 $190,217 21 $190,741 3 $137,073 APPLICATIONS DENIED 4 $168,430 6 $178,833 2 $99,675 APPLICATIONS WITHDRAWN 1 $340,270 8 $212,530 0 $0 FILES CLOSED FOR INCOMPLETENESS 1 $51,660 0 $0 0 $0
Aggregated Statistics For Year 2002(Based on 2 partial tracts) A) Conventional B) Refinancings C) Non-occupant Loans on Number Average Value Number Average Value Number Average Value
LOANS ORIGINATED 66 $204,635 57 $185,953 4 $115,318 APPLICATIONS APPROVED, NOT ACCEPTED 6 $215,582 19 $175,443 2 $149,090 APPLICATIONS DENIED 4 $272,065 2 $229,670 0 $0 APPLICATIONS WITHDRAWN 2 $158,570 4 $161,972 0 $0 FILES CLOSED FOR INCOMPLETENESS 1 $176,440 0 $0 1 $94,020
Aggregated Statistics For Year 2001(Based on 2 partial tracts) A) Conventional B) Refinancings C) Non-occupant Loans on Number Average Value Number Average Value Number Average Value
LOANS ORIGINATED 58 $197,168 80 $172,966 3 $162,120 APPLICATIONS APPROVED, NOT ACCEPTED 4 $224,395 13 $160,252 0 $0 APPLICATIONS DENIED 2 $191,300 6 $187,623 1 $148,290 APPLICATIONS WITHDRAWN 0 $0 3 $186,597 1 $70,810 FILES CLOSED FOR INCOMPLETENESS 0 $0 1 $91,700 0 $0
Aggregated Statistics For Year 2000(Based on 2 partial tracts) A) Conventional B) Refinancings C) Non-occupant Loans on Number Average Value Number Average Value Number Average Value
LOANS ORIGINATED 48 $158,510 11 $155,011 1 $160,770 APPLICATIONS APPROVED, NOT ACCEPTED 8 $154,055 5 $144,102 0 $0 APPLICATIONS DENIED 1 $96,270 2 $185,065 1 $96,270 APPLICATIONS WITHDRAWN 0 $0 1 $218,640 0 $0 FILES CLOSED FOR INCOMPLETENESS 1 $120,140 0 $0 0 $0
Aggregated Statistics For Year 1999(Based on 3 partial tracts) A) Conventional B) Refinancings C) Non-occupant Loans on Number Average Value Number Average Value Number Average Value
LOANS ORIGINATED 79 $157,957 44 $157,438 1 $66,690 APPLICATIONS APPROVED, NOT ACCEPTED 2 $158,925 9 $150,330 0 $0 APPLICATIONS DENIED 3 $133,487 6 $151,558 0 $0 APPLICATIONS WITHDRAWN 4 $204,135 1 $200,250 1 $115,190 FILES CLOSED FOR INCOMPLETENESS 1 $143,200 0 $0 0 $0
Detailed PMIC statistics for the following Tracts:
0317.02
, 0317.03 , 0317.04 , 0320.05 , 0320.07 Covington compared to Washington state average:
Unemployed percentage significantly below state average. Black race population percentage above state average. Foreign-born population percentage above state average. Renting percentage below state average. Length of stay since moving in above state average. House age below state average.
#63 on the list of "Top 101 cities with the smallest household incomes disparities (population 5,000+)"
#78 on the list of "Top 100 cities with highest median household income and median resident age less than 35 (pop. 5,000+)"
#94 on the list of "Top 101 cities with the most residents born in Other Western Asia (population 500+)"
#5 on the list of "Top 101 counties with the most Mainline Protestant congregations"
#8 on the list of "Top 101 counties with the lowest Ozone (1-hour) air pollution readings in 2012 (ppm)"
#9 on the list of "Top 101 counties with the most Other congregations"
#11 on the list of "Top 101 counties with the most Mainline Protestant adherents"
#11 on the list of "Top 101 counties with the highest percentage of residents that exercised in the past month"
Top Patent Applicants
Louis J. Bailey (11)
Karl Warfel (8)
Michael F. Bradley (6)
Terrance L. Thomas (6)
Richard A. Callis (6)
Jason Metzner (5)
David Gardner (5)
Phillip Dewayne Bondurant (5)
Andre Kashierski (4)
Patrick Greer Franklin (4)
Total of 162 patent applications in 2008-2024.
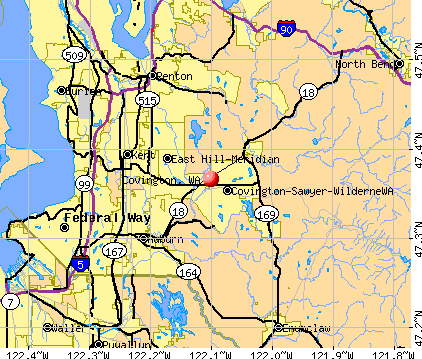


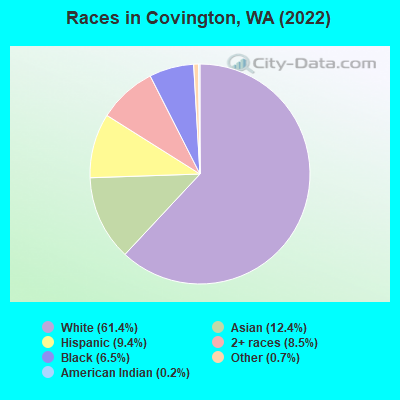
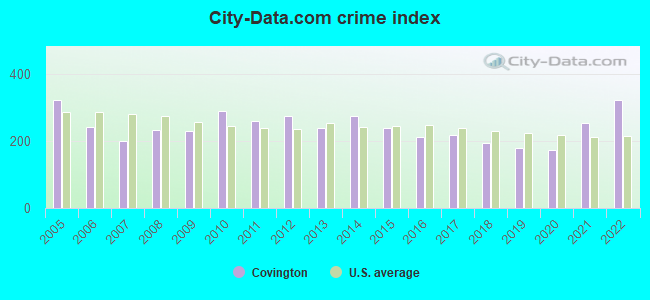
 Recent articles from our blog. Our writers, many of them Ph.D. graduates or candidates, create easy-to-read articles on a wide variety of topics.


 , pop. 52,781).
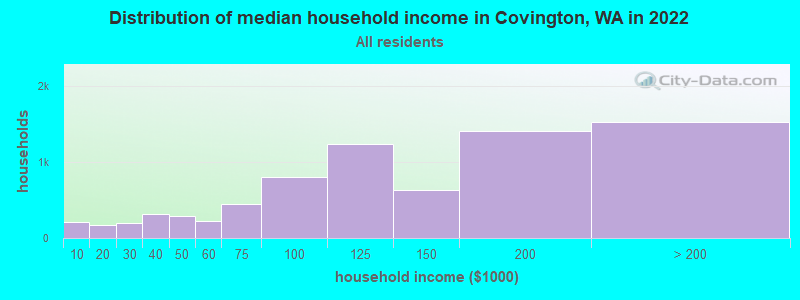
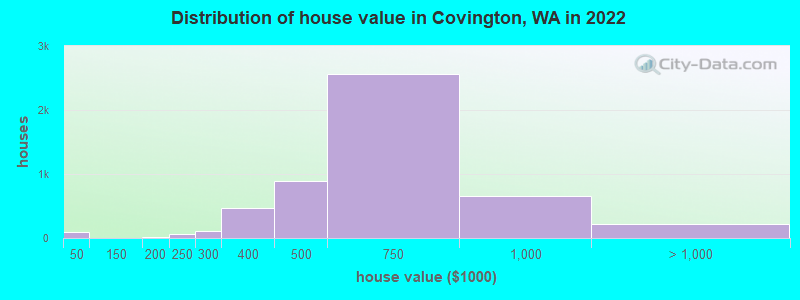

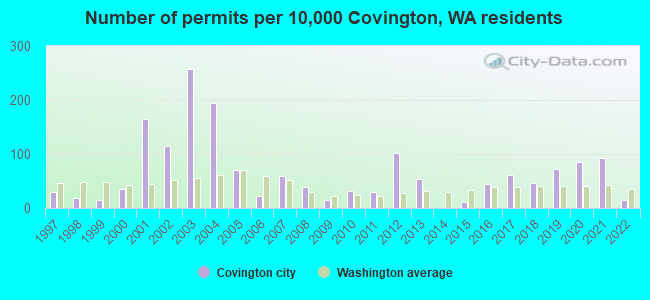
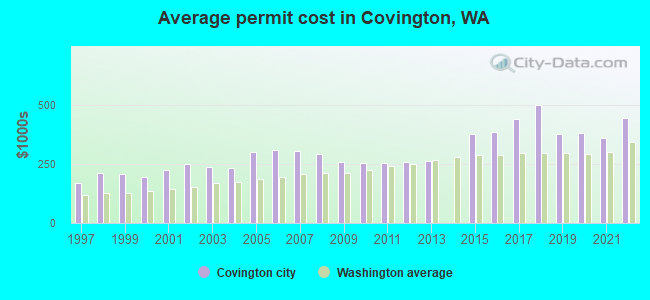
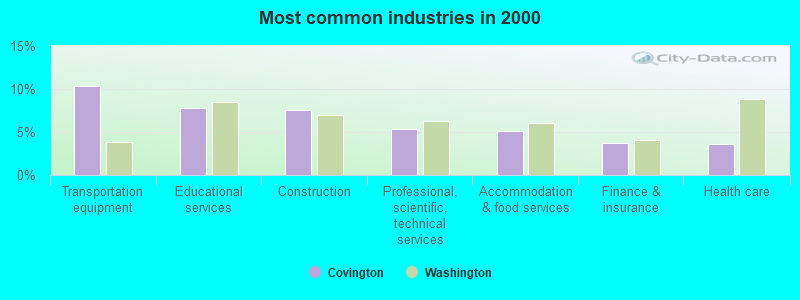
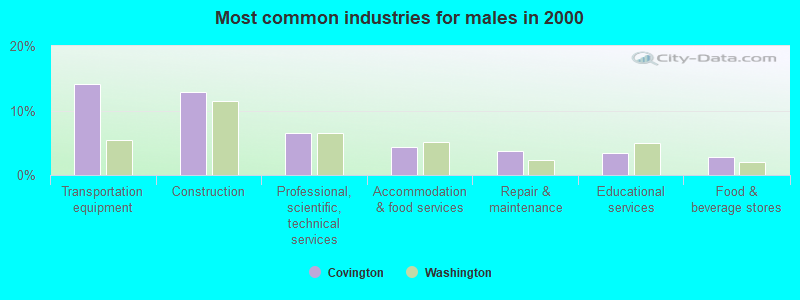
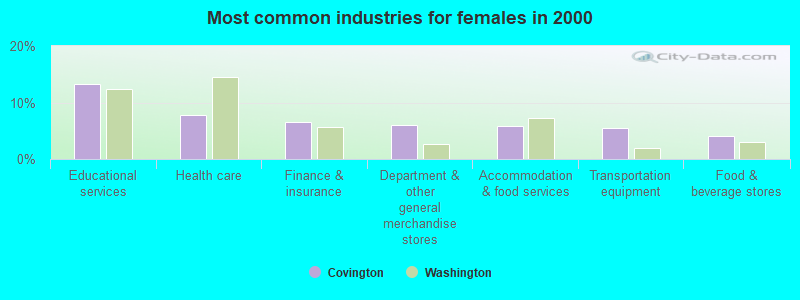
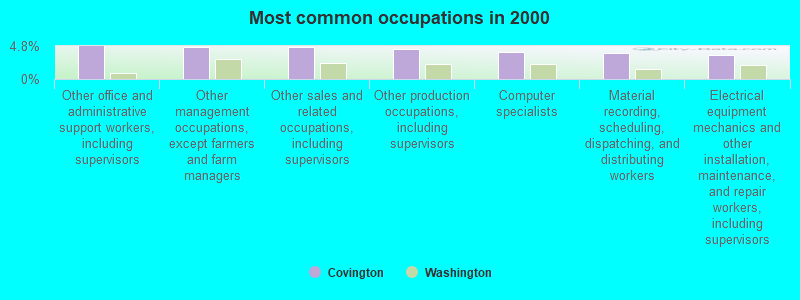
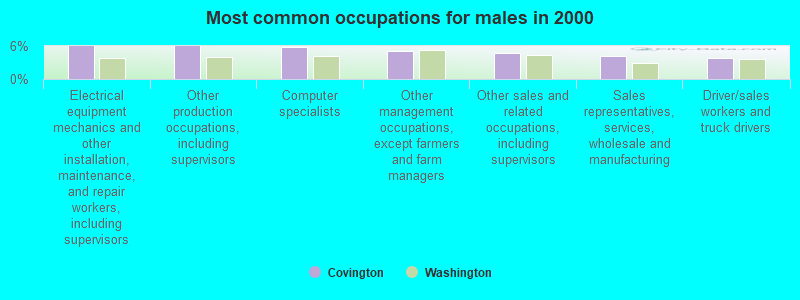
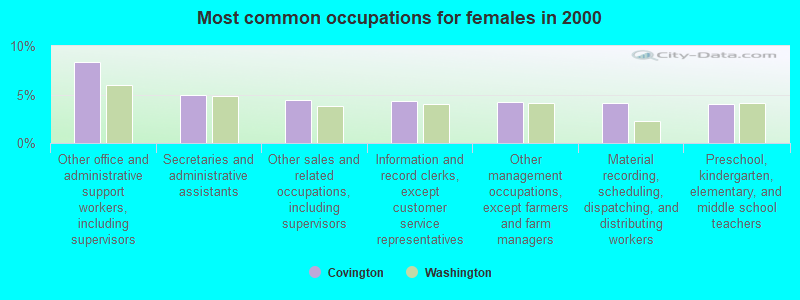


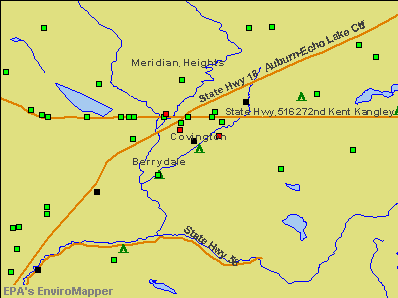

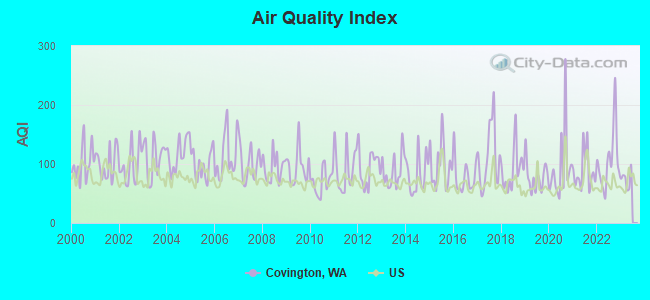
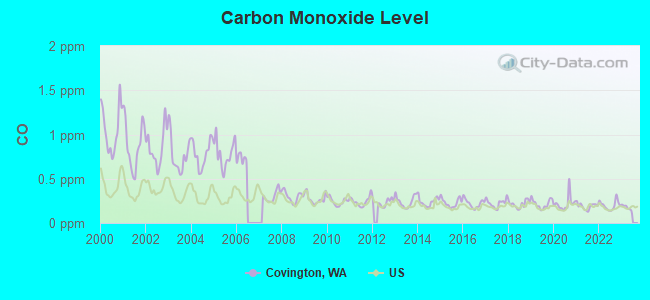
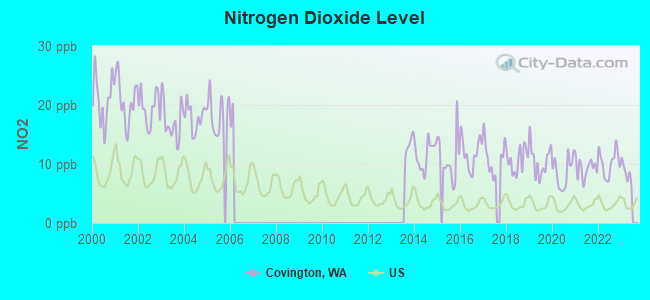
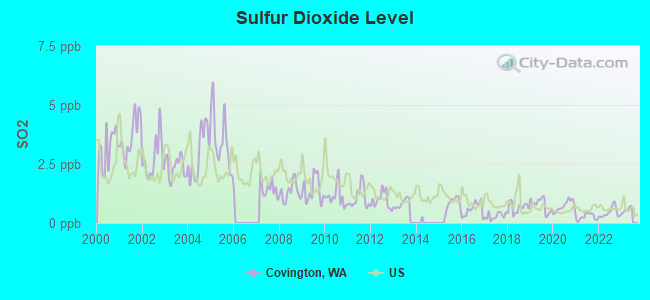
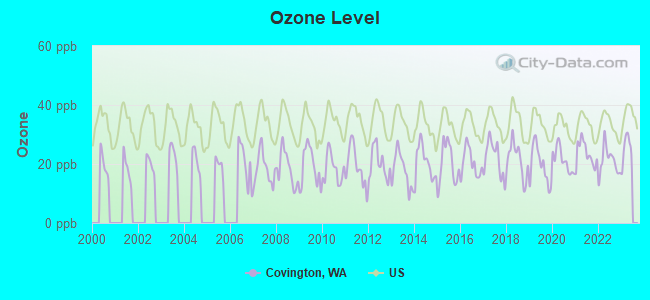
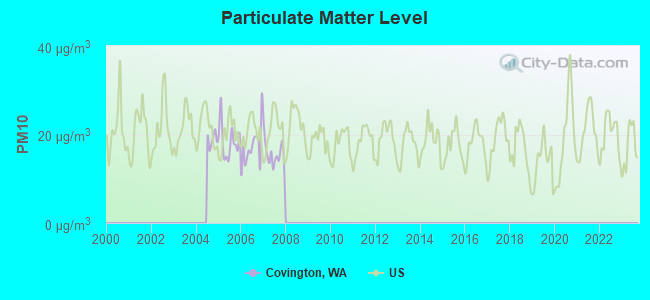
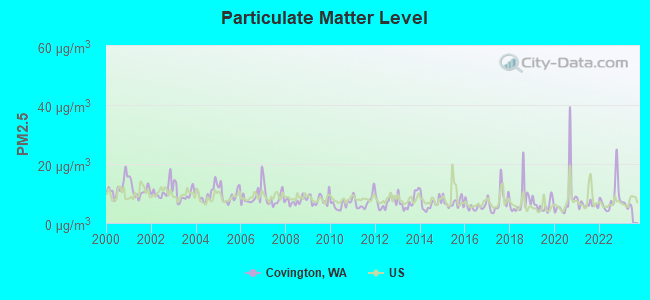
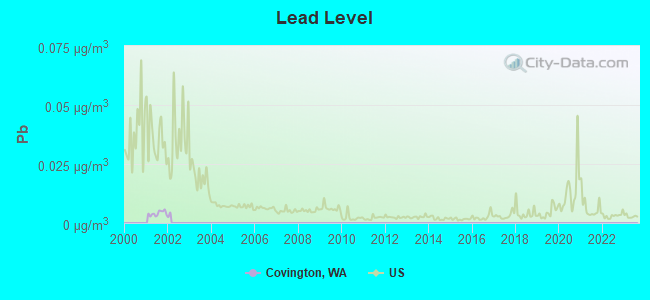
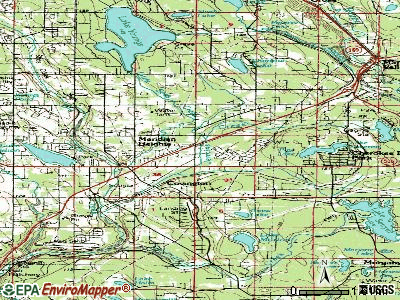
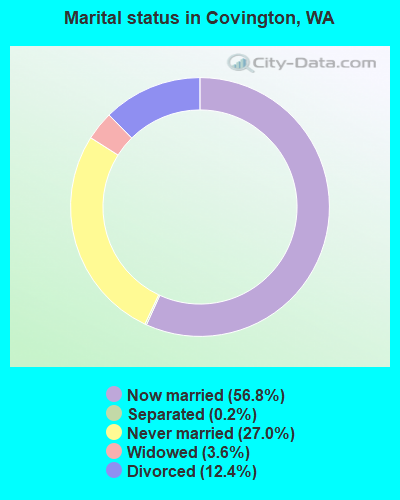
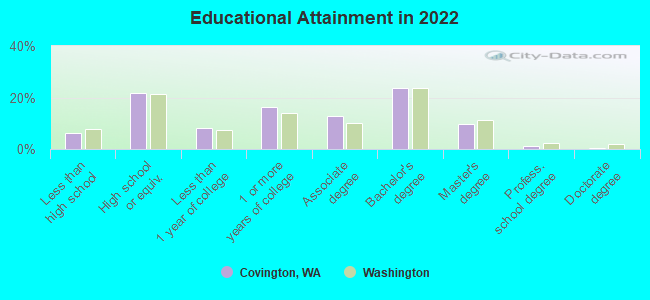
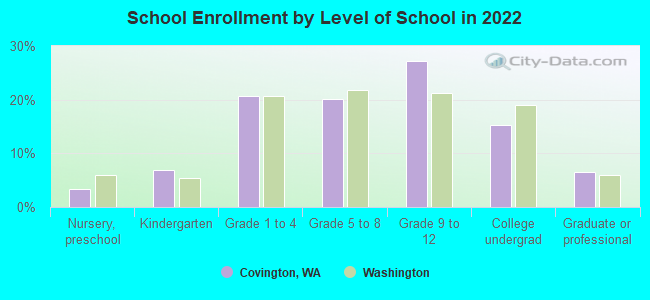
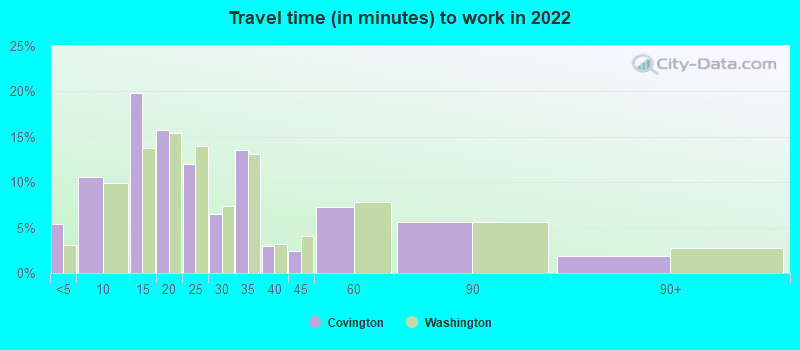
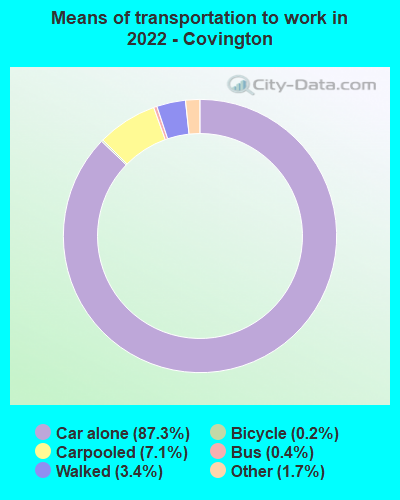
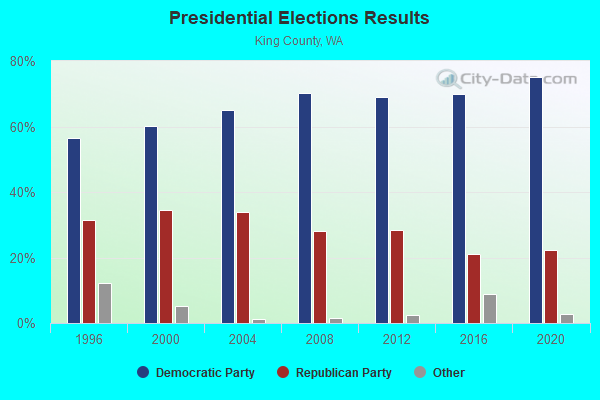
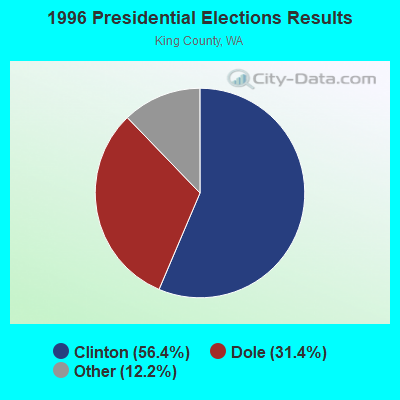
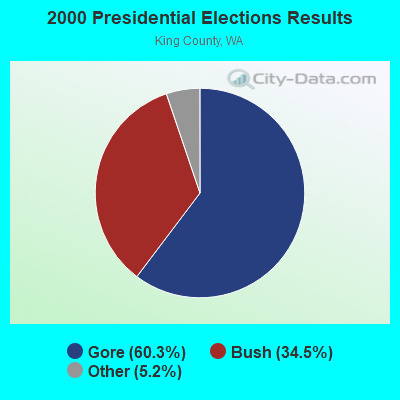
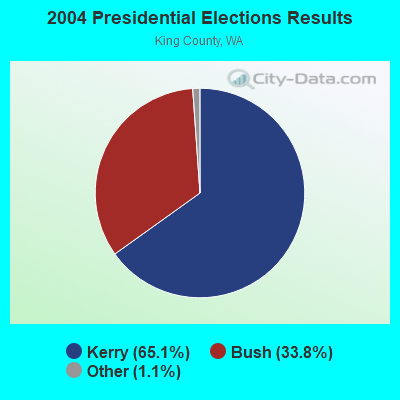
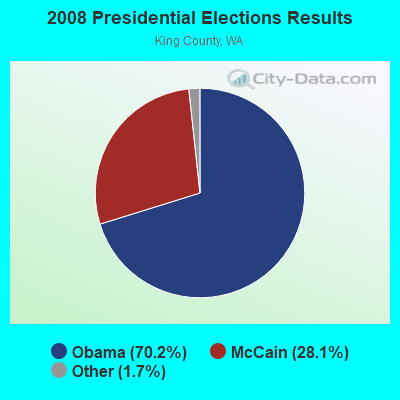
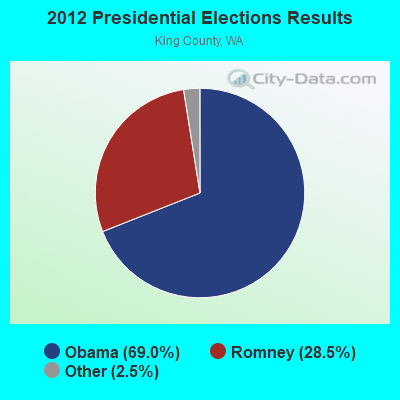
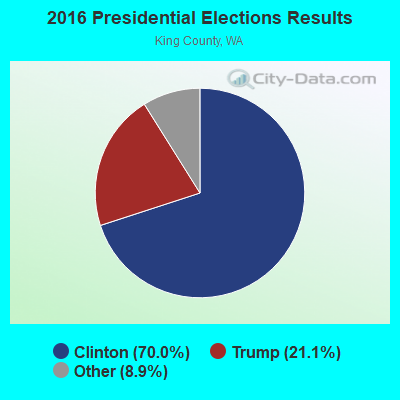
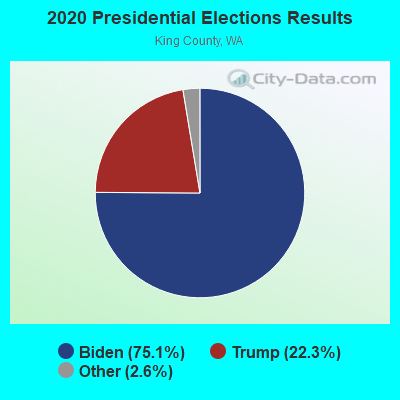
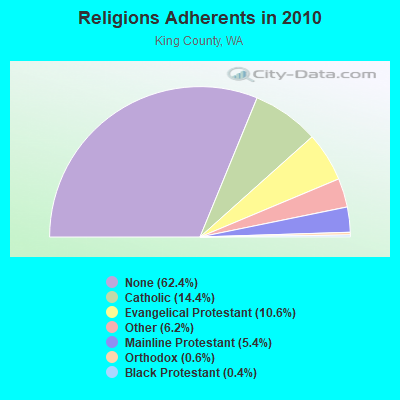
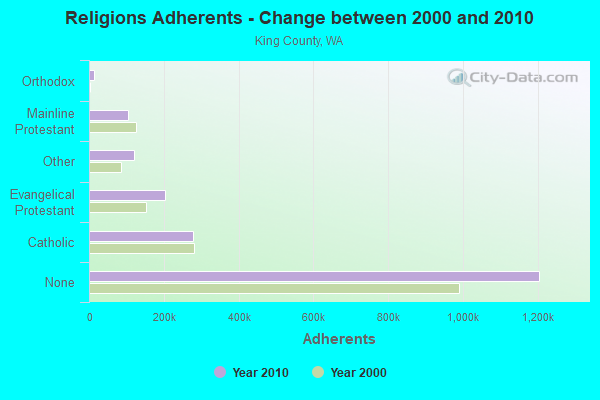
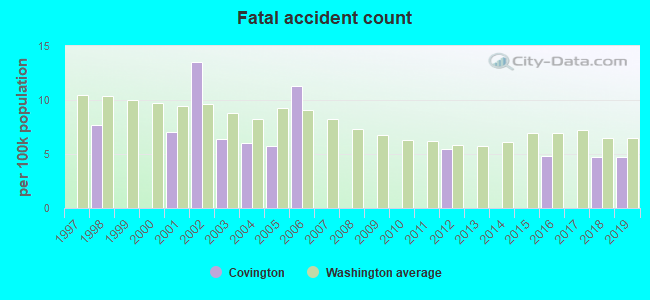
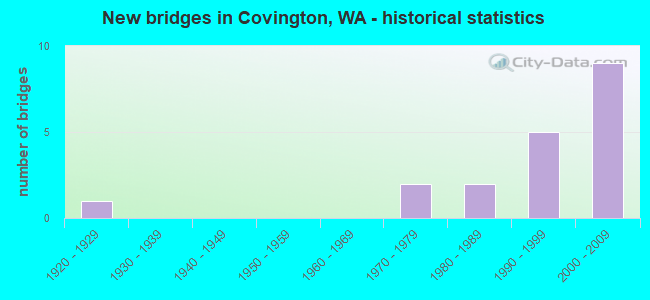
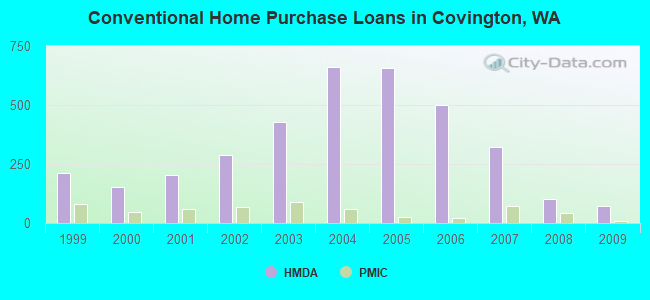
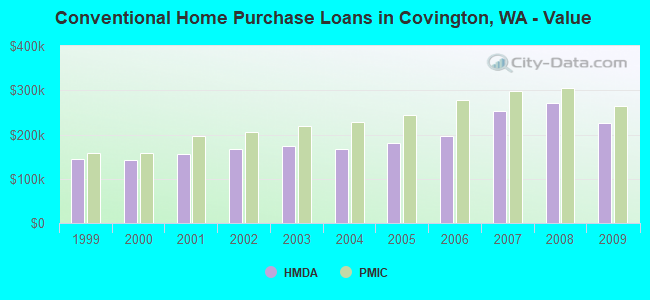
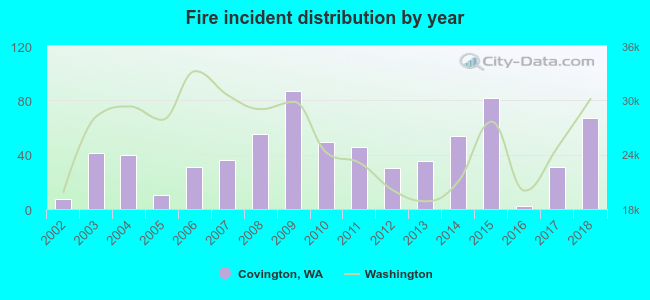 According to the data from the years 2002 - 2018 the average number of fires per year is 41. The highest number of fires - 87 took place in 2009, and the least - 2 in 2016. The data has an increasing trend.
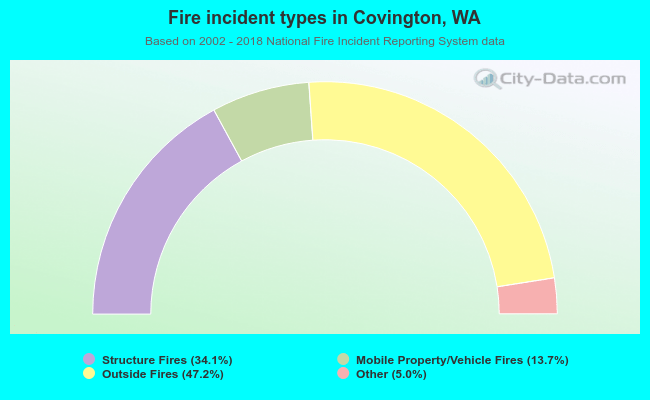 When looking into fire subcategories, the most reports belonged to: Outside Fires (47.2%), and Structure Fires (34.1%).