Covington: Fire Incidents, Washington (WA)
Where are fire incidents reported in Covington, WA
Something went wrong! Please refresh the page.
| Fire incidents reported | |
|---|---|
| Sreet name | Count |
| 272 ST | 102 |
| 272ND ST | 52 |
| COVINGTON WAY | 40 |
| 270 PL | 38 |
| WAX RD | 36 |
| 164 AVE | 28 |
| 180 AVE | 28 |
| TIMBERLANE WAY | 28 |
| 267 ST | 24 |
| 267 PL | 22 |
| 260 ST | 20 |
| 267TH ST | 20 |
| 168TH PL | 18 |
| 269 ST | 18 |
| 164TH AVE | 16 |
| 262 PL | 16 |
| 270TH PL | 16 |
| 186 AVE | 14 |
| 189 AVE | 14 |
| 256 ST | 14 |
| 264 ST | 14 |
| 268 ST | 14 |
| 190 AVE | 12 |
| 192 AVE | 12 |
| 263 ST | 12 |
| 268 PL | 12 |
| 168 PL | 10 |
| 174 PL | 10 |
| 185TH AVE | 10 |
| 201 AVE | 10 |
| Other | 23 |
2002 - 2018 National Fire Incident Reporting System (NFIRS) incidents
- Incident types reported to NFIRS in Covington, WA
- 3,48960.8%Rescue & EMS
- 70312.2%Fire
- 4728.2%Service Call
- 3936.8%Good Intent Call
- 3305.7%Hazardous Condition
- 3245.6%False Alarm
- 220.4%Special Incident
- 70.1%Overpressure Rupture
- Fire incident types reported to NFIRS in Covington, WA
- 33247.2%Outside Fires
- 24034.1%Structure Fires
- 9613.7%Mobile Property/Vehicle Fires
- 355.0%Other
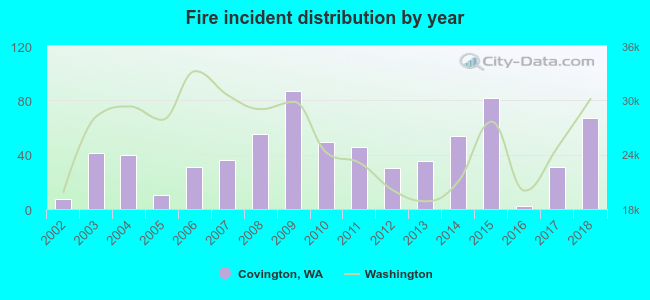 According to the data from the years 2002 - 2018 the average number of fires per year is 41. The highest number of fire incidents - 87 took place in 2009, and the least - 2 in 2016. The data has a rising trend.
The average number of yearly fire incidents per 10k residents in Covington, WA compared to nearest cities:
(Note: Based on data for the last 3 years, including only cities with population 5,000 and above)
| Covington: | 17.4 |
| Maple Valley: | 7.2 |
| Kent: | 38.4 |
| Auburn: | 54.1 |
| Renton: | 52.4 |
| Pacific: | 31.1 |
| Lake Tapps: | 10.1 |
| Des Moines: | 41.1 |
| SeaTac: | 44.2 |
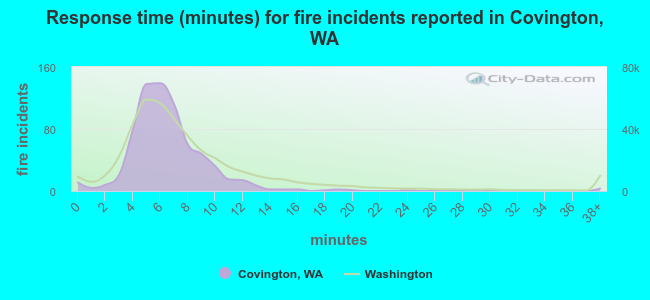 The median response time based on all reported fire incidents is 6 minutes. This is about the same as the state median value.
The median response time in Covington, WA compared to nearest cities:
(Note: Based on data for all years, including only cities with at least 500 fire incidents)
| Covington: | 6 minutes |
| Maple Valley: | 6 minutes |
| Kent: | 6 minutes |
| Auburn: | 6 minutes |
| Renton: | 6 minutes |
| Des Moines: | 5 minutes |
| SeaTac: | 5 minutes |
| Tukwila: | 6 minutes |
| Federal Way: | 6 minutes |
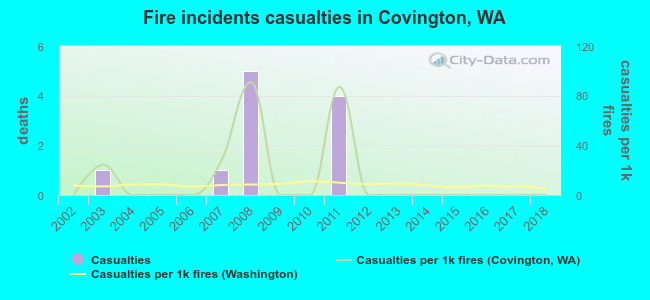 According to the data from the years 2002 - 2018 the average number of fire-related casualties per year is 1. The highest number of reported casualties - 5 took place in 2008, and the lowest - 0 in 2002. The data has a constant trend.
The average number of casualties per 1,000 fires is 14. This indicator was the highest - 91 in 2008, and the lowest 0 in 2002. The trend for casualties per 1,000 fires is constant. Compared to the Washington value the number of injuries per 1,000 fires is higher.
According to the data from the years 2002 - 2018 the average number of fire-related casualties per year is 1. The highest number of reported casualties - 5 took place in 2008, and the lowest - 0 in 2002. The data has a constant trend.
The average number of casualties per 1,000 fires is 14. This indicator was the highest - 91 in 2008, and the lowest 0 in 2002. The trend for casualties per 1,000 fires is constant. Compared to the Washington value the number of injuries per 1,000 fires is higher.Casualties per 1,000 incidents in Covington, WA compared to nearest cities:
(Note: Based on data for all years, including only cities with at least 500 fire incidents)
| Covington: | 15.6 |
| Maple Valley: | 3.1 |
| Kent: | 11.6 |
| Auburn: | 9.9 |
| Renton: | 17.9 |
| Des Moines: | 16.0 |
| SeaTac: | 19.7 |
| Tukwila: | 15.6 |
| Federal Way: | 21.1 |
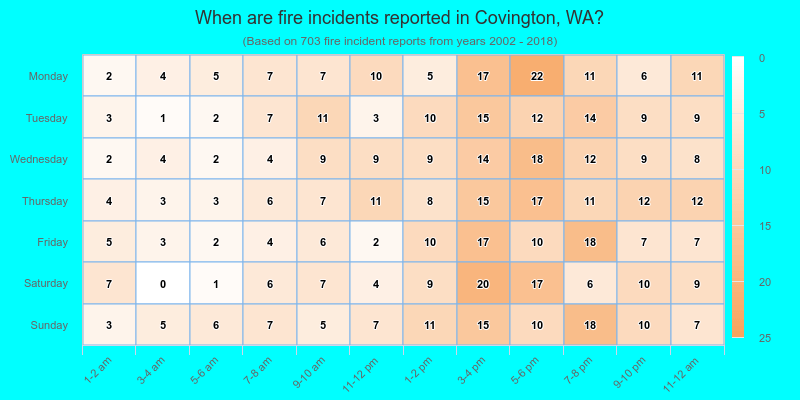
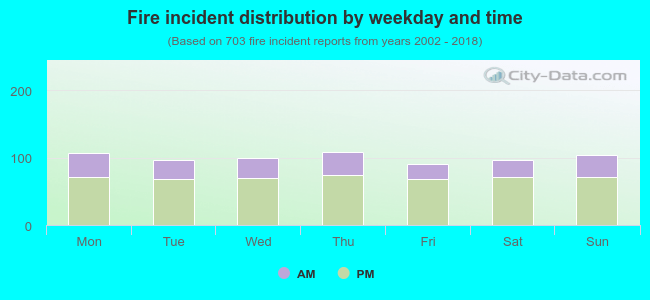 29.3% incidents where reported in the morning and 70.7% in the evening. The most fires (15.5%) took place on Thursday, and the least (12.9%) on Friday.
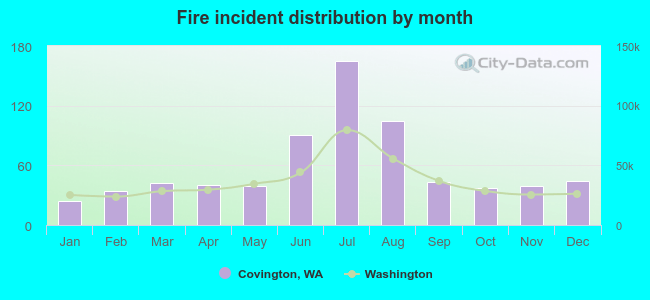 According to the 703 fire incidents from years 2002 - 2018 most fires (23.5%) took place during July, and the least (3.4%) in January.
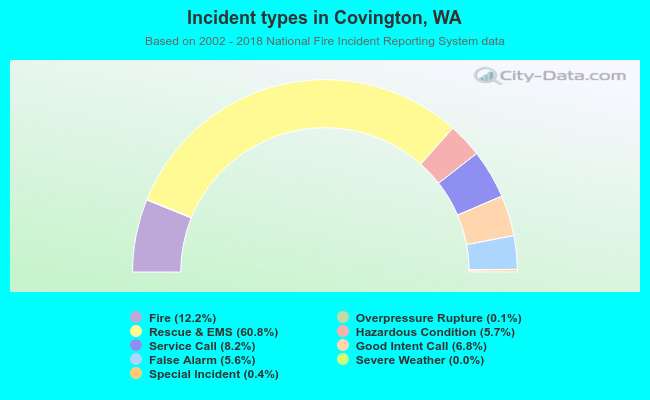 Out of all 5,741 cases reported during the years 2002 - 2018, the most belonged to the categories: Rescue & EMS (60.8%), Fire (12.2%), and Service Call (8.2%).
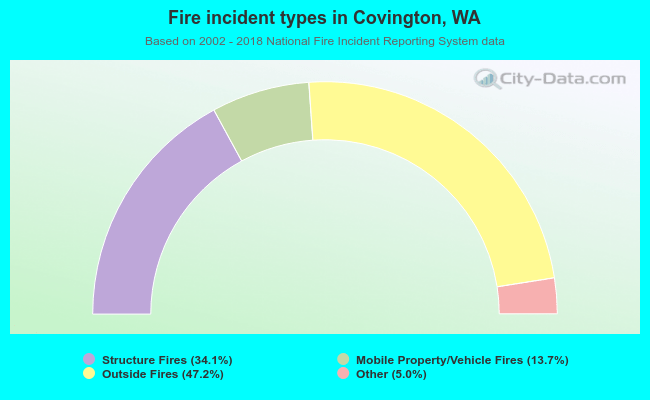 When looking into fire subcategories, the most incidents belonged to: Outside Fires (47.2%), and Structure Fires (34.1%).