Please register to participate in our discussions with 2 million other members - it's free and quick! Some forums can only be seen by registered members. After you create your account, you'll be able to customize options and access all our 15,000 new posts/day with fewer ads.
Yes, sorry. A couple Antarctic comments snowballed into hijacking the thread. As for arctic sea ice news, the arctic sea ice extent record has been broken obviously enough I didn't think it was worthy of comment (see the hotlinked extent graph I made in the first post). The margin is rather large, though as Nomander pointed out there several organizations measuring sea ice, so if interested you might want to check those. I think the sea ice extent this year broke the record in all the datasets, though. More interesting is a comment you made earlier:
Quote:
Originally Posted by Patricius Maximus
Another note: with the before and after maps it seems that the storm and melting has almost exclusively wiped out the areas that had a low ice concentration. The areas that had the densely-packed ice remained stable (by melt season standards). While everything could change between now and the minimum, I think the "low hanging fruit" has been picked off, and the melting rate has probably been maxed out. We're entering that time of year when the ice curve starts to bend. How much it bends will determine how low the minimum will go.
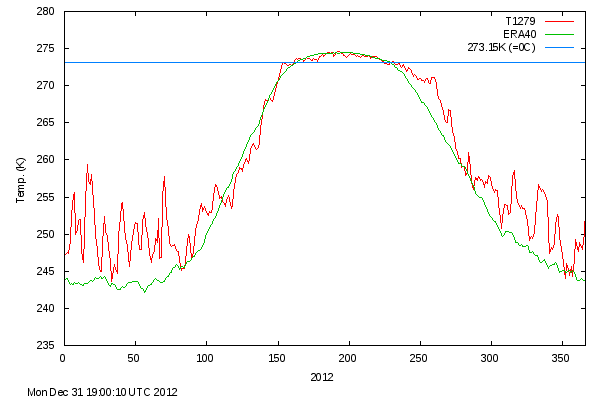
Eyeballing the first extent graph, it looks like the melt rate has bent a bit just recently but not really by much, far less than other years. I'd assume it will have to level off within the next few weeks, but at the moment still going strong. As candle's temperature graph shows the average air temperature above 79°N is below 0°C (note sea ice melting point is roughly -1.5°C or so due to higher salt content). So maybe not cold enough to encourage a refreeze, but any melt must be coming from warmer seawater.
This looks interesting to watch. There's a chunk of solid (purple) sea ice at 135°E near the north pole separated from the main block of sea ice by fragmented sea ice. Perhaps it could completely separate?
These sea ice maps seem to show less sea ice than others, though. Link will auto-update. I took a screenshot that I might upload later if there are real changes.
This may also be of interest...Three men — including one Canadian — on an expedition through the Northwest Passage have navigated their 31-foot fibreglass boat through the McClure strait, an Arctic route they say has never been passed by sailboat before. http://news.nationalpost.com/2012/08...cclure-strait/
According to the NSIDC dataset, the melt curve has begun to ever-so-slightly bend. We'll have to see if this becomes a trend going further into September. If I may make a prediction, I think the minimum this year will be around 3 000 000 square kilometers, plus or minus 250 000. We'll see if I'm right. Any other predictions?
Yea, the air temperature can't be causing any melt now, or could be the cause of the low sea ice, at least above 79°N. Unusual warmth below 79° might have had an impact. As I mentioned before, sea temperatures might be a bigger factor. Some of the water surrounding the ice is a degree or two Celsius.
which is a few degrees above normal (click on anamolies).
But not as much as a few weeks ago. Warm enough to melt lots of ice, though? Cooling should mean the melt rate should decline and perhaps level off soon.
According to the NSIDC dataset, the melt curve has begun to ever-so-slightly bend. We'll have to see if this becomes a trend going further into September. If I may make a prediction, I think the minimum this year will be around 3 000 000 square kilometers, plus or minus 250 000. We'll see if I'm right. Any other predictions?
The NSIDC numbers are 4.0 million square kilometers as of September 1. The IARC/JAXA numbers are 3.68 million kilometers as of today. They use different measuring standards, so they're not directly comparable. The NSDIC site said the August melt rate average 75,000 square kilometers / day while the usual is 40,000 square kilometers / day. So, a low of 3 million at the end of the month would require an average of 33,000 square kilometers / day. Since I assume the minimum would occur before the end of month and the melt rate must decline to 0 at the minimum (and the melt rate has started to slow — no longer at 75,000 square kilometers /day), I'm thinking a bit higher is more reasonable. I'm guessing 3.4 million square kilometers NSDIC numbers plus or minus 300,000.
Another record broken some days ago: PIOMASS sea ice volume. Interestingly, not by much. The extent record this year was broken much more.
So, if volume is only a little less than last year, but extent is much lower, what must of happened is a lot of thin melted away effecting the ice extent more than the volume. The average thickness of the ice remaining is now slightly higher than last year:
Average thickness is increasing? That is an intriguing figure this early in the season, though obviously not unprecedented.
Please register to post and access all features of our very popular forum. It is free and quick. Over $68,000 in prizes has already been given out to active posters on our forum. Additional giveaways are planned.
Detailed information about all U.S. cities, counties, and zip codes on our site: City-data.com.

 Please register to participate in our discussions with 2 million other members - it's free and quick! Some forums can only be seen by registered members. After you create your account, you'll be able to customize options and access all our 15,000 new posts/day with fewer ads.


") .
.