Please register to participate in our discussions with 2 million other members - it's free and quick! Some forums can only be seen by registered members. After you create your account, you'll be able to customize options and access all our 15,000 new posts/day with fewer ads.
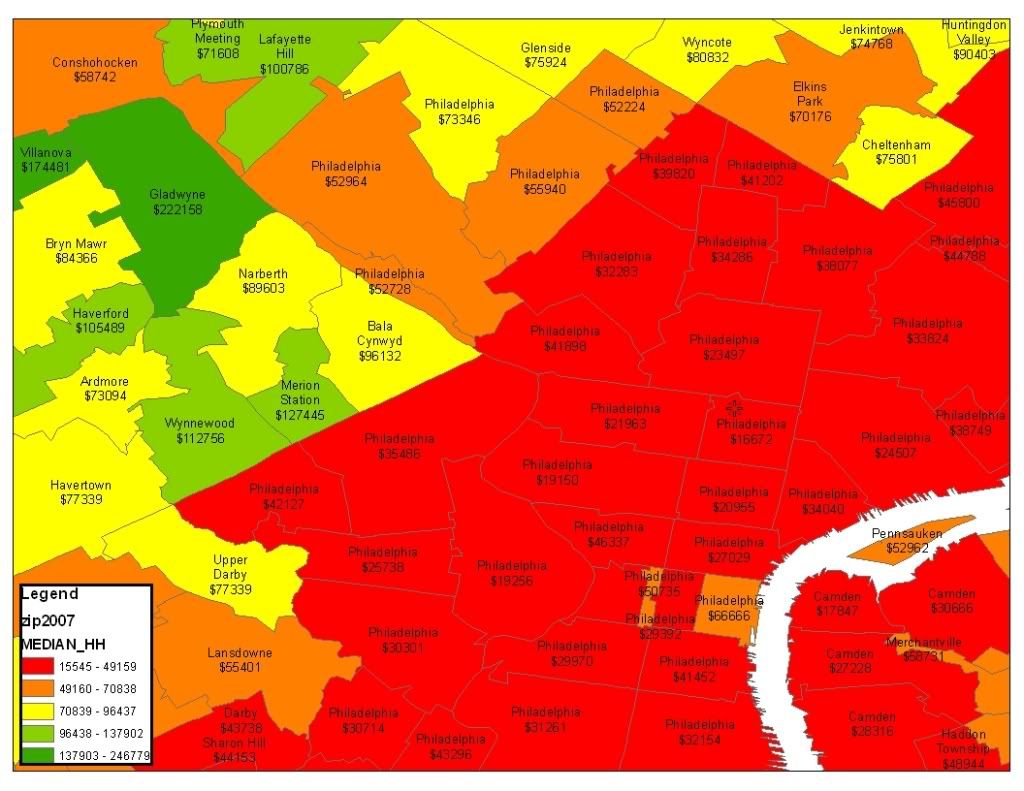
The Philly map doesnt look quite right. There should be some yellow downtown(Soceity Hill-Rittenhouse-Fitler) and some yellow NW Philly (Chestnut Hill) some orange in Mt Airy,East Falls,Manayunk,Roxborough,Andorra.
Mike can you get a blow up of Philly?
Society Hill and Rittenhouse are orange. All of Northwest Philly is orange, except for Chestnut Hill, which is yellow.
This is a map of household incomes by zip code, no? Household incomes are going to be much lower in zip codes with a higher percentage of single person households. Rittenhouse is a fine example. Consider as well how over-represented students are in Center City and University City.
If you want a more accurate representation of towns, don't use Zip codes as a lot of towns share zip codes and all the data are combined and averaged out.
Thats my boy! Fabrication,exaggeration and misrepresentation.
The Philly map doesnt look quite right. There should be some yellow downtown(Soceity Hill-Rittenhouse-Fitler) and some yellow NW Philly (Chestnut Hill) some orange in Mt Airy,East Falls,Manayunk,Roxborough,Andorra.
Center City is where the money is. South Philly is OK. Much of Philly is actually fine, but in the bad areas, it is as bad as anything gets. It is very, very tough.
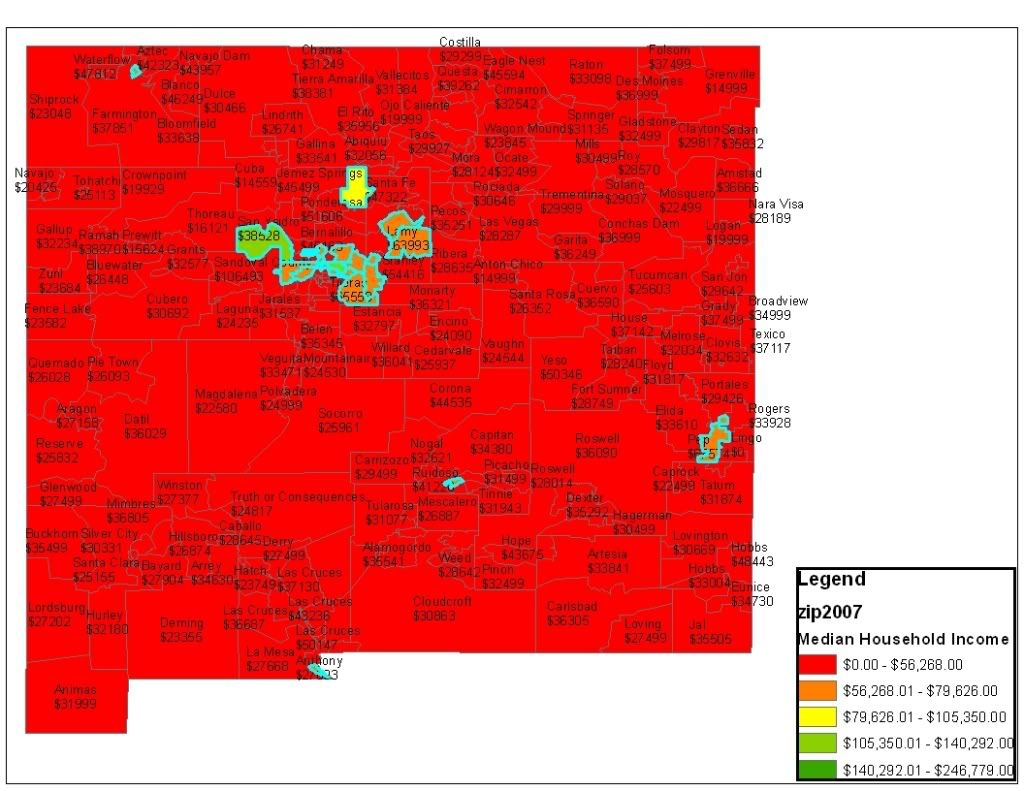
I have more disclosure here: this data is only culled from the Philly metro area + NJ, which amounts to over 1000 zip codes. If you were to add in the NYC zips and surrounding area that I posted yesterday, there would be only nominal normalization, because the aggregate median would hold steady or slightly increase. However, let's say I normalized this data by EVERY zip code in the US, you would start seeing many of these orange zips go yellow, and many yellow go to light green, because the median income is SO much higher in the northeast than the rest of the country. To wit, here is New Mexico, normalized by NJ and Philly's data:
There are 283 zips in New Mexico, only 20 of these are not in red, or over the break of $56,268. Only two are in even in light green.
it's amazing.
it would be awesome to have maps based on net worth, as that seems to be a more reliable indictor of wealth than median income. this also would remove all the "cost of living" issues we talk about - i.e. "you get paid more because housing costs are higher, therefore since i live in a lower COL area, i have more disposable income". i'm not sure the census tracks that though - do you know?
it would be awesome to have maps based on net worth, as that seems to be a more reliable indictor of wealth than median income. this also would remove all the "cost of living" issues we talk about - i.e. "you get paid more because housing costs are higher, therefore since i live in a lower COL area, i have more disposable income". i'm not sure the census tracks that though - do you know?
Or a 'disposable income' map, is what you are saying? I don't know if such data exists. However, I would imagine a map that had darker green areas in the midwest, and very red areas in states such as California (outside of L.A.) Oregon, Washington etc. The reason I put forth that premise is because it is my belief that housing values are relatively inexpensive in states such as upstate NY (near Buffalo), most of Ohio, Michigan, Indiana, Illinois (minus Chicagoland) and Iowa, however, there is proximity to many cities where salaries would be higher relative to housing costs. In contrast, these salaries begin to dissipate as you go further west, while housing costs go up. I think this is because more people retire west and south, and skilled labor salaries don't follow, thus, the household income flattens. Couple that with less housing, and you get demand over supply, and thus, higher housing costs. If you could make a map alone on median household income to housing costs, you'd see a map that would really go 'red' once you got west of the Rocky Mountains.
Please register to post and access all features of our very popular forum. It is free and quick. Over $68,000 in prizes has already been given out to active posters on our forum. Additional giveaways are planned.
Detailed information about all U.S. cities, counties, and zip codes on our site: City-data.com.

 Please register to participate in our discussions with 2 million other members - it's free and quick! Some forums can only be seen by registered members. After you create your account, you'll be able to customize options and access all our 15,000 new posts/day with fewer ads.