Williams: Fire Incidents, California (CA)
Where are fire incidents reported in Williams, CA
Something went wrong! Please refresh the page.
|
| |||||||||||||||||||||||||||||||||||||||||||||||||||||||||||||||||||||||||||||||||||||||||||||||||||||||||||||
2005 - 2018 National Fire Incident Reporting System (NFIRS) incidents
- Incident types reported to NFIRS in Williams, CA
- 1,99243.6%Rescue & EMS
- 1,01522.2%Fire
- 64514.1%Good Intent Call
- 47010.3%Service Call
- 3297.2%Hazardous Condition
- 1082.4%False Alarm
- 70.2%Special Incident
- 50.1%Overpressure Rupture
- Fire incident types reported to NFIRS in Williams, CA
- 65264.2%Outside Fires
- 19018.7%Structure Fires
- 15615.4%Mobile Property/Vehicle Fires
- 171.7%Other
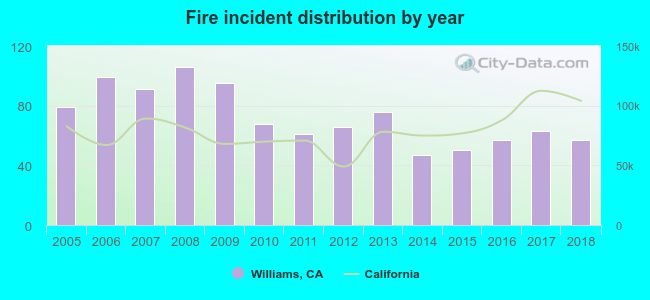 According to the data from the years 2005 - 2018 the average number of fire incidents per year is 73. The highest number of fires - 106 took place in 2008, and the least - 47 in 2014. The data has a dropping trend.
The average number of yearly fire incidents per 10k residents in Williams, CA compared to nearest cities:
(Note: Based on data for the last 3 years, including only cities with population 5,000 and above)
| Williams: | 113.6 |
| Colusa: | 101.5 |
| Willows: | 77.2 |
| Yuba City: | 39.0 |
| Gridley: | 7.6 |
| Clearlake: | 61.0 |
| Marysville: | 100.8 |
| Linda: | 2.8 |
| Olivehurst: | 8.5 |
 The median response time based on all reported fire incidents is 7 minutes. This is about the same as the state median value.
The median response time in Williams, CA compared to nearest cities:
(Note: Based on data for all years, including only cities with at least 500 fire incidents)
| Williams: | 7 minutes |
| Colusa: | 5 minutes |
| Arbuckle: | 10 minutes |
| Willows: | 5 minutes |
| Yuba City: | 6 minutes |
| Clearlake: | 6 minutes |
| Lower Lake: | 3 minutes |
| Marysville: | 6 minutes |
| Olivehurst: | 5 minutes |
 27.5% incidents where reported in the morning and 72.5% in the evening. The most fires (16.0%) took place on Thursday, and the least (12.5%) on Sunday.
 According to the 1,015 fire incident reports from years 2005 - 2018 most fires (13.1%) took place during August, and the least (3.2%) in February.
 Out of all 4,571 cases reported during the years 2005 - 2018, the most belonged to the categories: Rescue & EMS (43.6%), Fire (22.2%), and Good Intent Call (14.1%).
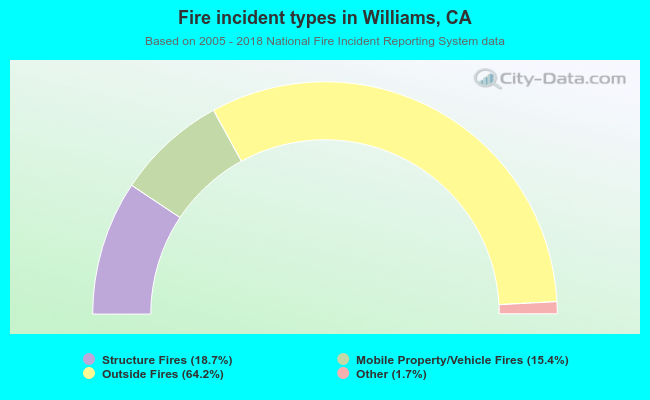 When looking into fire subcategories, the most incidents belonged to: Outside Fires (64.2%), and Structure Fires (18.7%).