Clearlake: Fire Incidents, California (CA)
Where are fire incidents reported in Clearlake, CA
Something went wrong! Please refresh the page.
| Fire incidents reported | |
|---|---|
| Sreet name | Count |
| LAKESHORE DR | 140 |
| OLYMPIC DR | 98 |
| OLD HWY 53 | 74 |
| DAM RD | 72 |
| 18TH AVE | 20 |
| BURNS VALLEY RD | 20 |
| LAKESHORE DRIVE | 20 |
| CEDAR AVE | 18 |
| OLD 53 | 18 |
| OLD HIGHWAY 53 | 18 |
| 19TH AVE | 16 |
| VILLA WAY | 16 |
| LAKESHORE DR | 14 |
| PALMER AVE | 14 |
| 33RD AVE | 12 |
| 40TH AVE | 12 |
| MULLEN AVE | 12 |
| SAN JOAQUIN AVE | 12 |
| SR 53 HWY | 12 |
| 10TH ST | 10 |
| 31ST AVE | 10 |
| 36TH AVE | 10 |
| 39TH AVE | 10 |
| 8TH ST | 10 |
| ARROWHEAD RD | 10 |
| DAVIS AVE | 10 |
| EAST LAKE DR | 10 |
| HEMLOCK AVE | 10 |
| PINE AVE | 10 |
| WEST 40TH | 10 |
| Other | 355 |
2002 - 2018 National Fire Incident Reporting System (NFIRS) incidents
- Incident types reported to NFIRS in Clearlake, CA
- 12,58079.3%Rescue & EMS
- 1,0836.8%Fire
- 8175.2%Good Intent Call
- 6464.1%Service Call
- 3822.4%Hazardous Condition
- 3071.9%False Alarm
- 370.2%Special Incident
- Fire incident types reported to NFIRS in Clearlake, CA
- 45542.0%Outside Fires
- 42639.3%Structure Fires
- 11010.2%Mobile Property/Vehicle Fires
- 928.5%Other
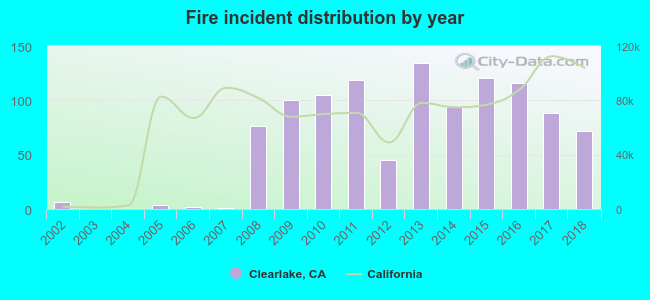 According to the data from the years 2002 - 2018 the average number of fires per year is 64. The highest number of reported fires - 134 took place in 2013, and the least - 0 in 2003. The data has a rising trend.
The average number of yearly fire incidents per 10k residents in Clearlake, CA compared to nearest cities:
(Note: Based on data for the last 3 years, including only cities with population 5,000 and above)
| Clearlake: | 61.0 |
| Hidden Valley Lake: | 3.6 |
| Cloverdale: | 44.7 |
| Calistoga: | 9.4 |
| Healdsburg: | 46.6 |
| Williams: | 113.6 |
| Windsor: | 13.4 |
| Ukiah: | 86.8 |
| Santa Rosa: | 17.5 |
 The median response time based on all reported fire incidents is 6 minutes. This is close to the California median value.
The median response time in Clearlake, CA compared to nearest cities:
(Note: Based on data for all years, including only cities with at least 500 fire incidents)
| Clearlake: | 6 minutes |
| Lower Lake: | 3 minutes |
| Kelseyville: | 8 minutes |
| Healdsburg: | 8 minutes |
| Williams: | 7 minutes |
| Windsor: | 6 minutes |
| Arbuckle: | 10 minutes |
| Ukiah: | 5 minutes |
| Santa Rosa: | 6 minutes |
 Based on the reports from the years 2002 - 2018 the average number of fire-related fatalities per year is 0. The highest number of deaths - 1 took place in 2014, and the lowest - 0 in 2002. The data has a constant trend.
 31.8% incidents where reported in the morning and 68.2% in the evening. The most fires (15.1%) took place on Thursday, and the least (13.6%) on Monday.
 According to the 1,083 fire incidents from years 2002 - 2018 most fires (12.8%) took place during July, and the least (5.2%) in February.
 Out of all 15,860 cases reported during the years 2002 - 2018, the most belonged to the categories: Rescue & EMS (79.3%), Fire (6.8%), and Good Intent Call (5.2%).
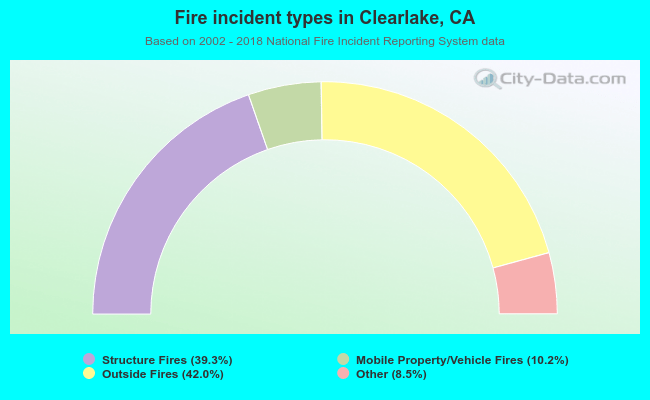 When looking into fire subcategories, the most incidents belonged to: Outside Fires (42.0%), and Structure Fires (39.3%).