Cloverdale: Fire Incidents, California (CA)
Where are fire incidents reported in Cloverdale, CA
Something went wrong! Please refresh the page.
|
| |||||||||||||||||||||||||||||||||||||||||||||||||||||||||||||||||||||||||||||||||||||||||||||||||||||||||||||
2005 - 2018 National Fire Incident Reporting System (NFIRS) incidents
- Incident types reported to NFIRS in Cloverdale, CA
- 3,14264.1%Rescue & EMS
- 56611.6%Service Call
- 4579.3%Fire
- 3046.2%Good Intent Call
- 2334.8%Hazardous Condition
- 1833.7%False Alarm
- 70.1%Severe Weather
- 50.1%Special Incident
- Fire incident types reported to NFIRS in Cloverdale, CA
- 27560.2%Outside Fires
- 10723.4%Structure Fires
- 4810.5%Mobile Property/Vehicle Fires
- 275.9%Other
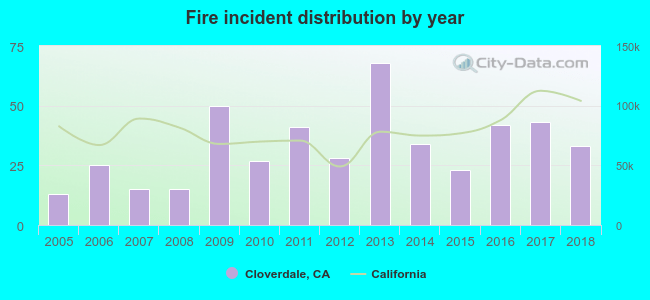 According to the data from the years 2005 - 2018 the average number of fires per year is 33. The highest number of reported fires - 68 took place in 2013, and the least - 13 in 2005. The data has a rising trend.
The average number of yearly fire incidents per 10k residents in Cloverdale, CA compared to nearest cities:
(Note: Based on data for the last 3 years, including only cities with population 5,000 and above)
| Cloverdale: | 44.7 |
| Healdsburg: | 46.6 |
| Windsor: | 13.4 |
| Clearlake: | 61.0 |
| Hidden Valley Lake: | 3.6 |
| Ukiah: | 86.8 |
| Calistoga: | 9.4 |
| Sebastopol: | 88.3 |
| Santa Rosa: | 17.5 |

 32.2% incidents where reported in the morning and 67.8% in the evening. The most fires (16.8%) took place on Saturday, and the least (12.9%) on Tuesday.
 According to the 457 incident reports from years 2005 - 2018 most fires (14.7%) took place during June, and the least (2.0%) in December.
 Out of all 4,900 cases reported during the years 2005 - 2018, the most belonged to the categories: Rescue & EMS (64.1%), Service Call (11.6%), and Fire (9.3%).
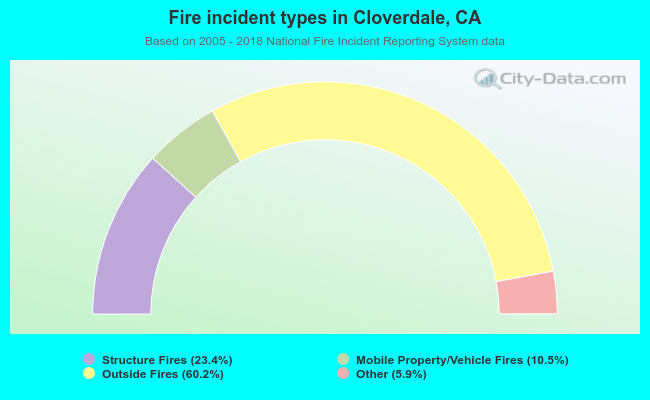 When looking into fire subcategories, the most incidents belonged to: Outside Fires (60.2%), and Structure Fires (23.4%).