Olivehurst: Fire Incidents, California (CA)
Where are fire incidents reported in Olivehurst, CA
Something went wrong! Please refresh the page.
|
| |||||||||||||||||||||||||||||||||||||||||||||||||||||||||||||||||||||||||||||||||||||||||||||||||||||||||||||
2005 - 2018 National Fire Incident Reporting System (NFIRS) incidents
- Incident types reported to NFIRS in Olivehurst, CA
- 56464.7%Fire
- 9611.0%Hazardous Condition
- 859.7%Good Intent Call
- 768.7%Rescue & EMS
- 515.8%Service Call
- Fire incident types reported to NFIRS in Olivehurst, CA
- 32357.3%Outside Fires
- 14726.1%Structure Fires
- 6110.8%Mobile Property/Vehicle Fires
- 335.9%Other
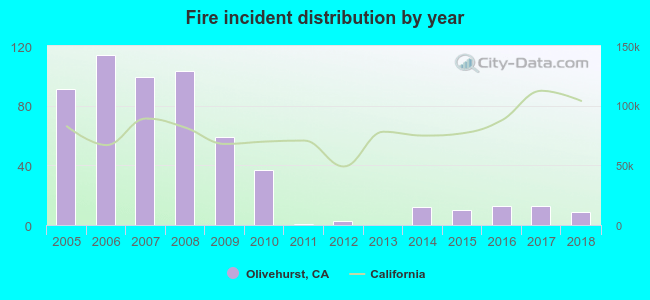 Based on the data from the years 2005 - 2018 the average number of fires per year is 40. The highest number of reported fire incidents - 114 took place in 2006, and the least - 0 in 2013. The data has a declining trend.
The average number of yearly fire incidents per 10k residents in Olivehurst, CA compared to nearest cities:
(Note: Based on data for the last 3 years, including only cities with population 5,000 and above)
| Olivehurst: | 8.5 |
| Linda: | 2.8 |
| Plumas Lake: | 17.1 |
| Marysville: | 100.8 |
| Yuba City: | 39.0 |
| Lincoln: | 17.6 |
| Gridley: | 7.6 |
| Palermo: | 78.7 |
| Rocklin: | 17.7 |
 The median response time based on all reported fire incidents is 5 minutes. This is lower than the state median value.
The median response time in Olivehurst, CA compared to nearest cities:
(Note: Based on data for all years, including only cities with at least 500 fire incidents)
| Olivehurst: | 5 minutes |
| Marysville: | 6 minutes |
| Yuba City: | 6 minutes |
| Lincoln: | 9 minutes |
| Penn Valley: | 10 minutes |
| Palermo: | 7 minutes |
| Rocklin: | 6 minutes |
| Elverta: | 6 minutes |
| Colusa: | 5 minutes |
 33.7% incidents where reported in the morning and 66.3% in the evening. The most fires (17.4%) took place on Saturday, and the least (13.1%) on Wednesday.
 According to the 564 incident reports from years 2005 - 2018 most fires (16.5%) took place during July, and the least (3.5%) in November.
 Out of all 872 cases reported during the years 2005 - 2018, the most belonged to the categories: Fire (64.7%), Rescue & EMS (11.0%), and Service Call (9.7%).
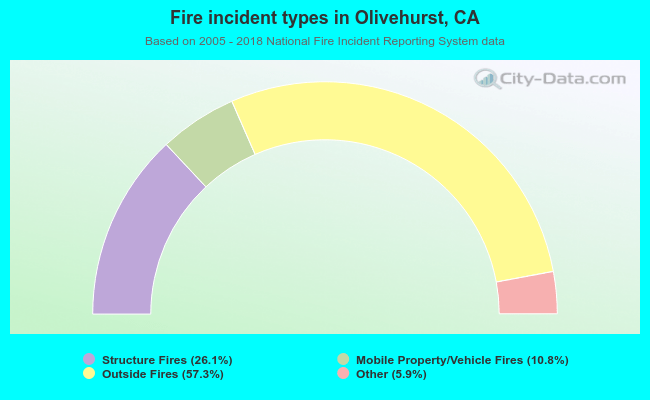 When looking into fire subcategories, the most reports belonged to: Outside Fires (57.3%), and Structure Fires (26.1%).