Palermo: Fire Incidents, California (CA)
Where are fire incidents reported in Palermo, CA
Something went wrong! Please refresh the page.
|
| |||||||||||||||||||||||||||||||||||||||||||||||||||||||||||||||||||||||||||||||||||||||||||||||||||||||||||||
2003 - 2018 National Fire Incident Reporting System (NFIRS) incidents
- Incident types reported to NFIRS in Palermo, CA
- 3,58366.8%Rescue & EMS
- 69012.9%Fire
- 4037.5%Service Call
- 2484.6%Good Intent Call
- 2134.0%False Alarm
- 2043.8%Hazardous Condition
- 160.3%Special Incident
- 60.1%Overpressure Rupture
- Fire incident types reported to NFIRS in Palermo, CA
- 42962.2%Outside Fires
- 14020.3%Structure Fires
- 9613.9%Mobile Property/Vehicle Fires
- 253.6%Other
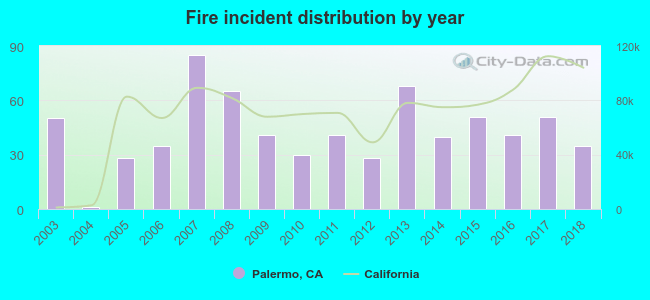 According to the data from the years 2003 - 2018 the average number of fires per year is 43. The highest number of fire incidents - 85 took place in 2007, and the least - 1 in 2004. The data has a decreasing trend.
The average number of yearly fire incidents per 10k residents in Palermo, CA compared to nearest cities:
(Note: Based on data for the last 3 years, including only cities with population 5,000 and above)
| Palermo: | 78.7 |
| Oroville: | 7.8 |
| Thermalito: | 30.6 |
| Gridley: | 7.6 |
| Feather Falls: | 7.9 |
| Durham: | 19.9 |
| Marysville: | 100.8 |
| Yuba City: | 39.0 |
| Linda: | 2.8 |
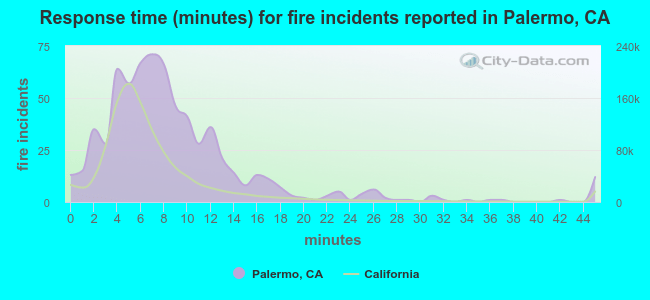 The median response time based on all reported fire incidents is 7 minutes. This is comparable to the state median value.
The median response time in Palermo, CA compared to nearest cities:
(Note: Based on data for all years, including only cities with at least 500 fire incidents)
| Palermo: | 7 minutes |
| Oroville: | 4 minutes |
| Marysville: | 6 minutes |
| Yuba City: | 6 minutes |
| Paradise: | 4 minutes |
| Olivehurst: | 5 minutes |
| Penn Valley: | 10 minutes |
| Chico: | 5 minutes |
| Grass Valley: | 7 minutes |
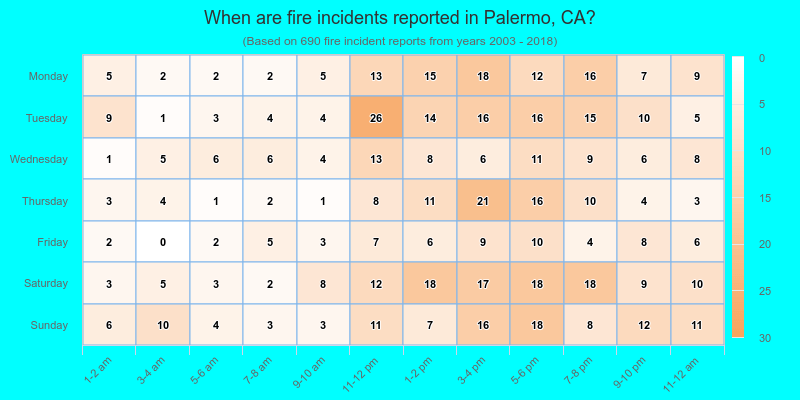
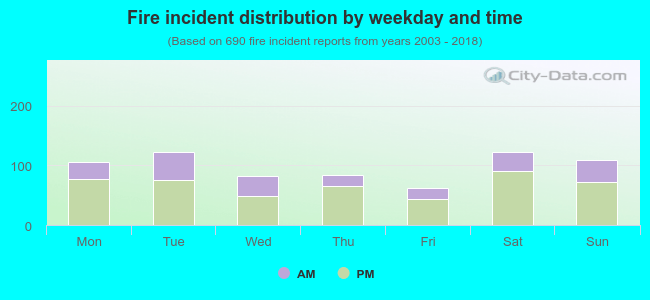 31.7% incidents where reported in the morning and 68.3% in the evening. The most fires (17.8%) took place on Tuesday, and the least (9.0%) on Friday.
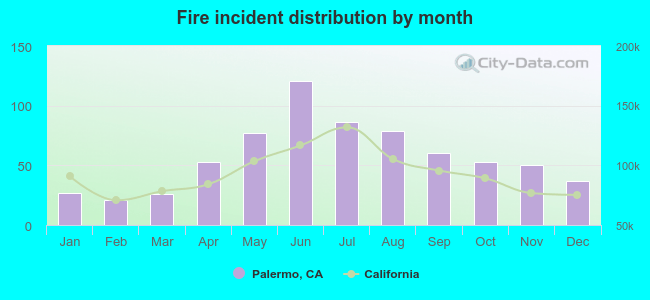 Based on the 690 incident reports from years 2003 - 2018 most fires (17.5%) took place during June, and the least (3.0%) in February.
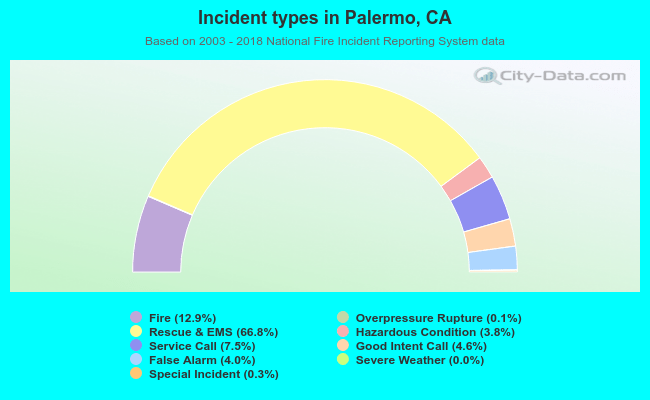 Out of all 5,364 cases reported during the years 2003 - 2018, the most belonged to the categories: Rescue & EMS (66.8%), Fire (12.9%), and Service Call (7.5%).
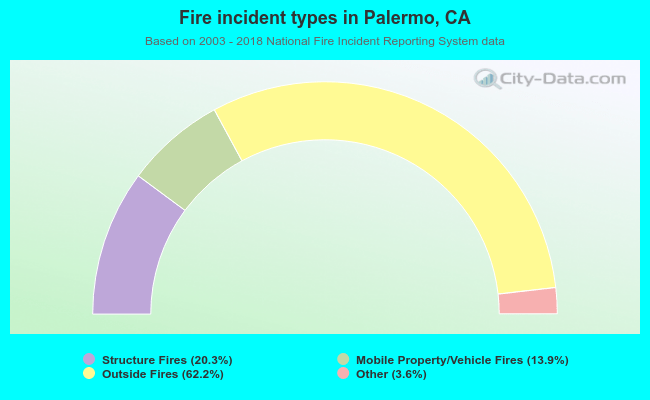 When looking into fire subcategories, the most incidents belonged to: Outside Fires (62.2%), and Structure Fires (20.3%).