Rocklin: Fire Incidents, California (CA)
Where are fire incidents reported in Rocklin, CA
Something went wrong! Please refresh the page.
| Fire incidents reported | |
|---|---|
| Sreet name | Count |
| ROCKLIN RD | 100 |
| PACIFIC ST | 80 |
| SUNSET BL | 58 |
| SUNSET BL | 46 |
| I80 | 40 |
| STANFORD RANCH RD | 34 |
| GRANITE DR | 28 |
| 5TH ST | 26 |
| EB I80 | 22 |
| DOMINGUEZ RD | 20 |
| GREENBRAE RD | 18 |
| MIDAS AVE | 18 |
| SUNSET BLVD | 18 |
| WB I80 | 18 |
| WOODSIDE DR | 18 |
| COBBLESTONE DR | 16 |
| WHITNEY BL | 16 |
| BLUE OAKS BL | 14 |
| CLUBHOUSE DR | 14 |
| GROVE ST | 14 |
| LONETREE BL | 14 |
| SIERRA COLLEGE BL | 14 |
| 3RD ST | 12 |
| AGUILAR RD | 12 |
| EL DON DR | 12 |
| MIDAS AV | 12 |
| SIERRA COLLEGE | 12 |
| SOUTHSIDE RANCH RD | 12 |
| SPRINGVIEW DR | 12 |
| WHITNEY RANCH PKY | 12 |
| Other | 302 |
2005 - 2018 National Fire Incident Reporting System (NFIRS) incidents
- Incident types reported to NFIRS in Rocklin, CA
- 12,33864.8%Rescue & EMS
- 2,43512.8%Good Intent Call
- 1,6218.5%Service Call
- 1,0445.5%Fire
- 9865.2%False Alarm
- 5723.0%Hazardous Condition
- 330.2%Severe Weather
- Fire incident types reported to NFIRS in Rocklin, CA
- 43441.6%Outside Fires
- 40438.7%Structure Fires
- 13913.3%Mobile Property/Vehicle Fires
- 676.4%Other
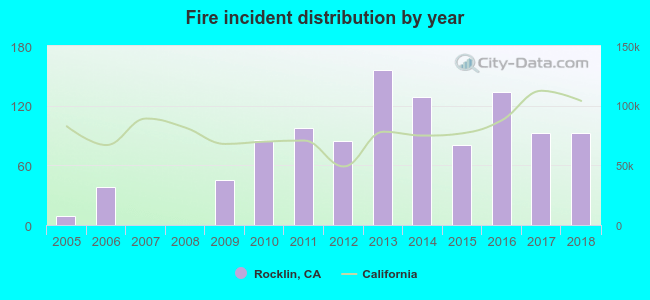 According to the data from the years 2005 - 2018 the average number of fire incidents per year is 75. The highest number of reported fires - 156 took place in 2013, and the least - 0 in 2007. The data has a rising trend.
The average number of yearly fire incidents per 10k residents in Rocklin, CA compared to nearest cities:
(Note: Based on data for the last 3 years, including only cities with population 5,000 and above)
| Rocklin: | 17.7 |
| Loomis: | 98.1 |
| Roseville: | 22.8 |
| Granite Bay: | 28.4 |
| Lincoln: | 17.6 |
| Citrus Heights: | 28.1 |
| Antelope: | 11.7 |
| Orangevale: | 13.5 |
| Folsom: | 7.3 |
 The median response time based on all reported fire incidents is 6 minutes. This is comparable to the California median value.
The median response time in Rocklin, CA compared to nearest cities:
(Note: Based on data for all years, including only cities with at least 500 fire incidents)
| Rocklin: | 6 minutes |
| Loomis: | 8 minutes |
| Roseville: | 5 minutes |
| Granite Bay: | 7 minutes |
| Lincoln: | 9 minutes |
| Citrus Heights: | 5 minutes |
| Antelope: | 5 minutes |
| Orangevale: | 5 minutes |
| Fair Oaks: | 5 minutes |
 26.8% incidents where reported in the morning and 73.2% in the evening. The most fires (17.6%) took place on Monday, and the least (12.2%) on Tuesday.
 According to the 1,044 fire incident reports from years 2005 - 2018 most fires (16.5%) took place during July, and the least (4.8%) in December.
 Out of all 19,049 cases reported during the years 2005 - 2018, the most belonged to the categories: Rescue & EMS (64.8%), Good Intent Call (12.8%), and Service Call (8.5%).
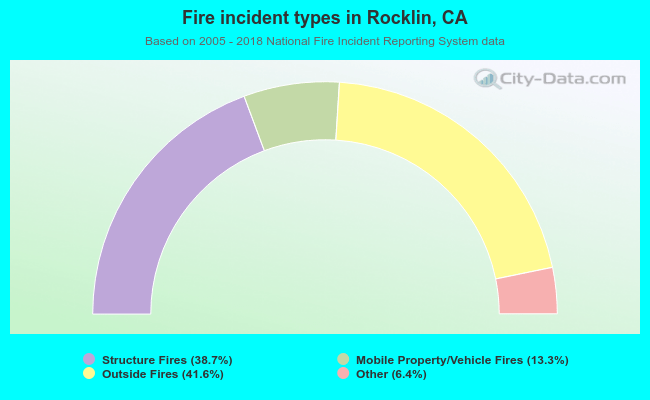 When looking into fire subcategories, the most incidents belonged to: Outside Fires (41.6%), and Structure Fires (38.7%).