Loomis: Fire Incidents, California (CA)
Where are fire incidents reported in Loomis, CA
Something went wrong! Please refresh the page.
|
| |||||||||||||||||||||||||||||||||||||||||||||||||||||||||||||||||||||||||||||||||||||||||||||||||||||||||||||
2005 - 2018 National Fire Incident Reporting System (NFIRS) incidents
- Incident types reported to NFIRS in Loomis, CA
- 3,34555.0%Rescue & EMS
- 89114.6%Good Intent Call
- 64410.6%Service Call
- 5879.7%Fire
- 2984.9%Hazardous Condition
- 2854.7%False Alarm
- 230.4%Special Incident
- 70.1%Overpressure Rupture
- Fire incident types reported to NFIRS in Loomis, CA
- 29850.8%Outside Fires
- 18231.0%Structure Fires
- 7212.3%Mobile Property/Vehicle Fires
- 356.0%Other
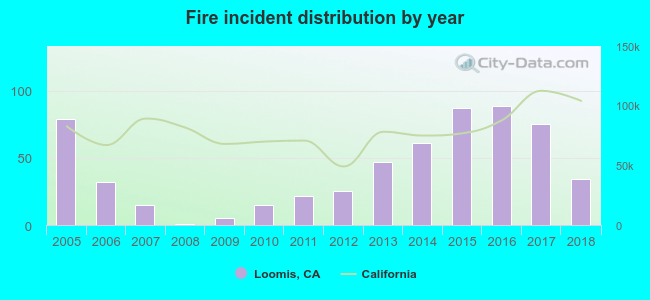 According to the data from the years 2005 - 2018 the average number of fire incidents per year is 42. The highest number of fires - 89 took place in 2016, and the least - 1 in 2008. The data has a decreasing trend.
The average number of yearly fire incidents per 10k residents in Loomis, CA compared to nearest cities:
(Note: Based on data for the last 3 years, including only cities with population 5,000 and above)
| Loomis: | 98.1 |
| Rocklin: | 17.7 |
| Granite Bay: | 28.4 |
| Roseville: | 22.8 |
| Lincoln: | 17.6 |
| Auburn: | 84.0 |
| Orangevale: | 13.5 |
| Citrus Heights: | 28.1 |
| Folsom: | 7.3 |
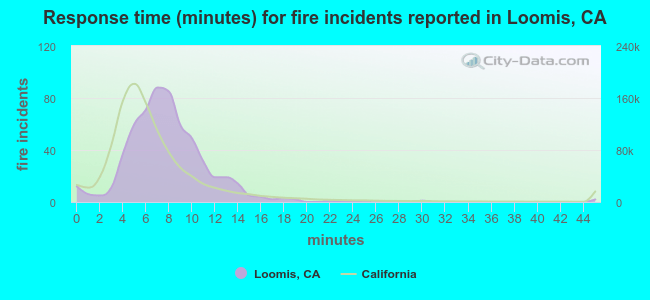 The median response time based on all reported fire incidents is 8 minutes. This is higher compared to the California median value.
The median response time in Loomis, CA compared to nearest cities:
(Note: Based on data for all years, including only cities with at least 500 fire incidents)
| Loomis: | 8 minutes |
| Rocklin: | 6 minutes |
| Granite Bay: | 7 minutes |
| Roseville: | 5 minutes |
| Lincoln: | 9 minutes |
| Auburn: | 6 minutes |
| Orangevale: | 5 minutes |
| Citrus Heights: | 5 minutes |
| Antelope: | 5 minutes |
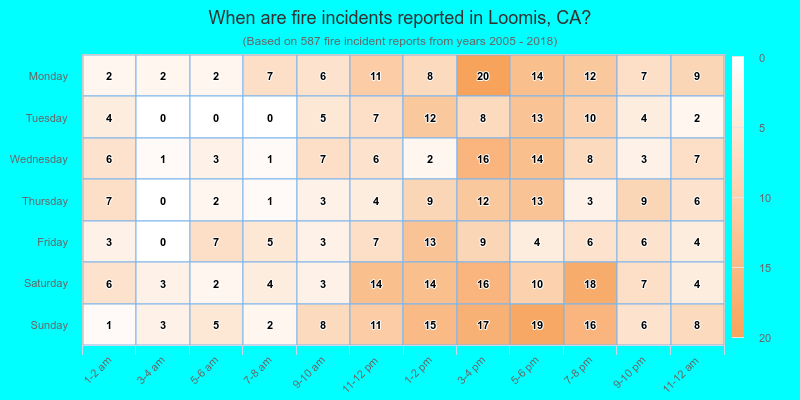
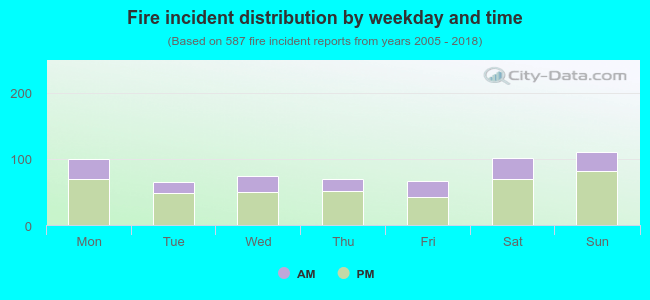 29.6% incidents where reported in the morning and 70.4% in the evening. The most fires (18.9%) took place on Sunday, and the least (11.1%) on Tuesday.
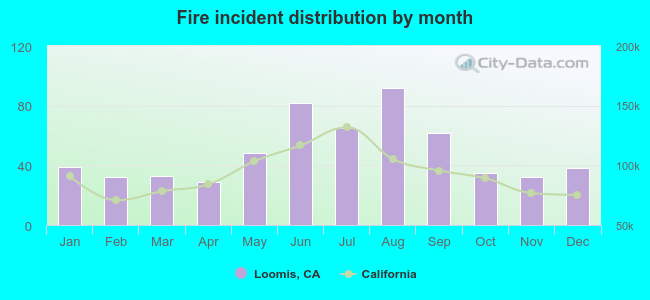 According to the 587 incident reports from years 2005 - 2018 most fires (15.7%) took place during August, and the least (4.9%) in April.
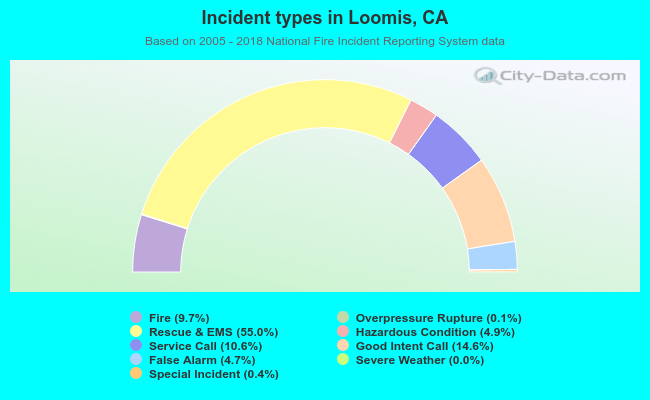 Out of all 6,082 cases reported during the years 2005 - 2018, the most belonged to the categories: Rescue & EMS (55.0%), Good Intent Call (14.6%), and Service Call (10.6%).
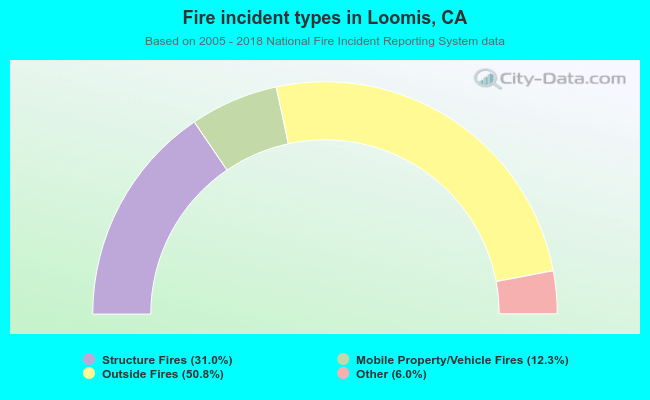 When looking into fire subcategories, the most reports belonged to: Outside Fires (50.8%), and Structure Fires (31.0%).