Auburn: Fire Incidents, California (CA)
Where are fire incidents reported in Auburn, CA
Something went wrong! Please refresh the page.
|
| |||||||||||||||||||||||||||||||||||||||||||||||||||||||||||||||||||||||||||||||||||||||||||||||||||||||||||||
| Other | 433 | |||||||||||||||||||||||||||||||||||||||||||||||||||||||||||||||||||||||||||||||||||||||||||||||||||||||||||||
2002 - 2018 National Fire Incident Reporting System (NFIRS) incidents
- Incident types reported to NFIRS in Auburn, CA
- 5,33257.3%Rescue & EMS
- 1,30214.0%Fire
- 1,03811.1%Good Intent Call
- 6386.9%Service Call
- 5566.0%Hazardous Condition
- 4104.4%False Alarm
- 230.2%Overpressure Rupture
- 130.1%Special Incident
- Fire incident types reported to NFIRS in Auburn, CA
- 57844.4%Outside Fires
- 40631.2%Structure Fires
- 24618.9%Mobile Property/Vehicle Fires
- 735.6%Other
 According to the data from the years 2002 - 2018 the average number of fires per year is 77. The highest number of reported fire incidents - 144 took place in 2005, and the least - 0 in 2003. The data has a rising trend.
The average number of yearly fire incidents per 10k residents in Auburn, CA compared to nearest cities:
(Note: Based on data for the last 3 years, including only cities with population 5,000 and above)
| Auburn: | 84.0 |
| Loomis: | 98.1 |
| Rocklin: | 17.7 |
| Granite Bay: | 28.4 |
| Lincoln: | 17.6 |
| El Dorado Hills: | 24.3 |
| Roseville: | 22.8 |
| Alta Sierra: | 4.3 |
| Cameron Park: | 17.6 |
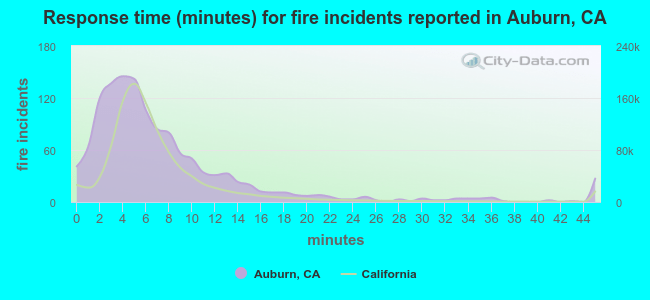 The median response time based on all reported fire incidents is 6 minutes. This is about the same as the state median value.
The median response time in Auburn, CA compared to nearest cities:
(Note: Based on data for all years, including only cities with at least 500 fire incidents)
| Auburn: | 6 minutes |
| Loomis: | 8 minutes |
| Rocklin: | 6 minutes |
| Granite Bay: | 7 minutes |
| Lincoln: | 9 minutes |
| El Dorado Hills: | 6 minutes |
| Roseville: | 5 minutes |
| Orangevale: | 5 minutes |
| Citrus Heights: | 5 minutes |
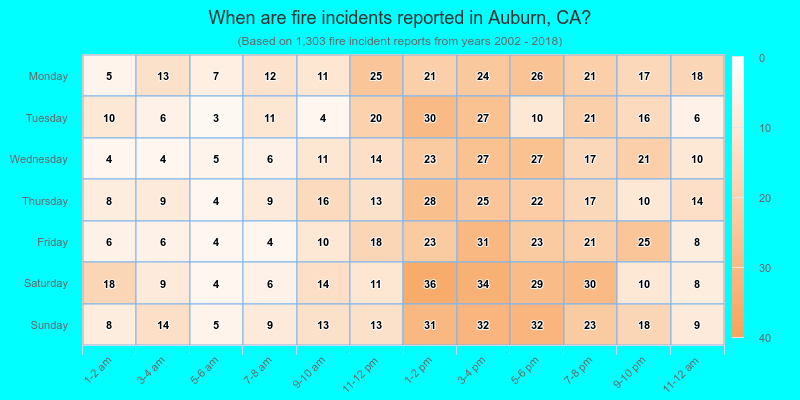
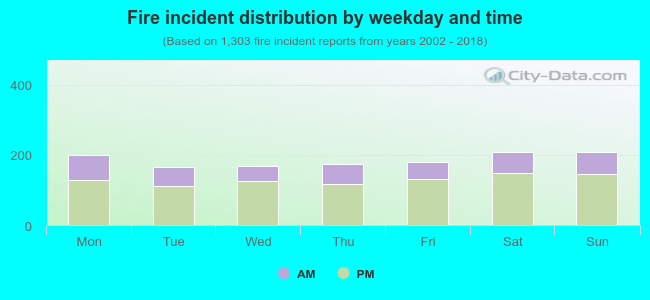 30.9% incidents where reported in the morning and 69.1% in the evening. The most fires (16.0%) took place on Saturday, and the least (12.6%) on Tuesday.
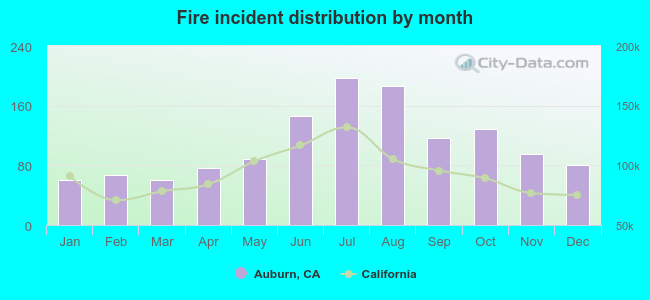 According to the 1,303 fire incidents from years 2002 - 2018 most fires (15.1%) took place during July, and the least (4.6%) in January.
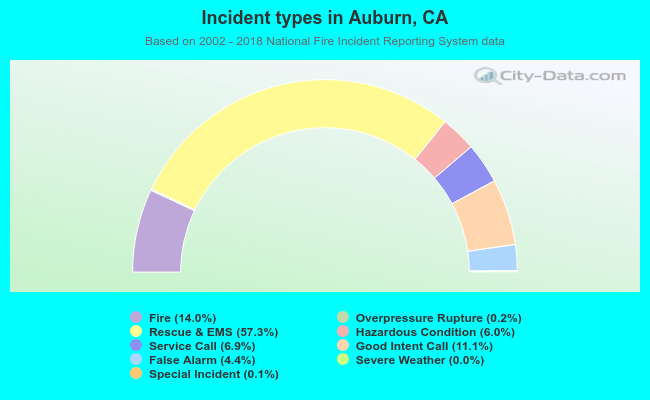 Out of all 9,313 cases reported during the years 2002 - 2018, the most belonged to the categories: Rescue & EMS (57.3%), Fire (14.0%), and Good Intent Call (11.1%).
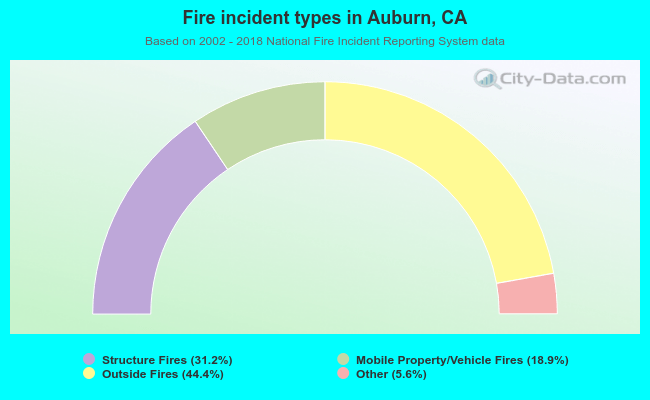 When looking into fire subcategories, the most incidents belonged to: Outside Fires (44.4%), and Structure Fires (31.2%).