Socorro: Fire Incidents, Texas (TX)
Where are fire incidents reported in Socorro, TX
Something went wrong! Please refresh the page.
|
| |||||||||||||||||||||||||||||||||||||||||||||||||||||||||||||||||||||||||||||||||||||||||||||||||||||||||||||
| Other | 148 | |||||||||||||||||||||||||||||||||||||||||||||||||||||||||||||||||||||||||||||||||||||||||||||||||||||||||||||
2003 - 2018 National Fire Incident Reporting System (NFIRS) incidents
- Incident types reported to NFIRS in Socorro, TX
- 1,49554.9%Rescue & EMS
- 57421.1%Fire
- 36213.3%Hazardous Condition
- 1274.7%Service Call
- 1234.5%Good Intent Call
- 371.4%False Alarm
- 40.1%Special Incident
- Fire incident types reported to NFIRS in Socorro, TX
- 23841.5%Outside Fires
- 19233.4%Structure Fires
- 7513.1%Other
- 6912.0%Mobile Property/Vehicle Fires
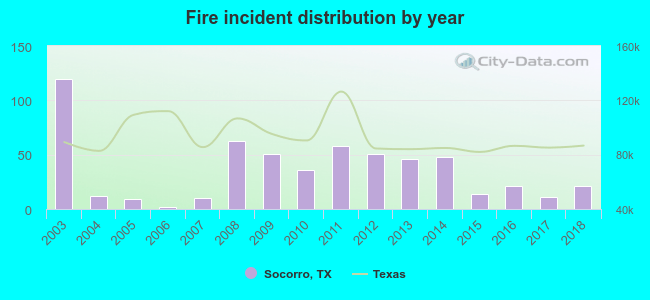 According to the data from the years 2003 - 2018 the average number of fires per year is 36. The highest number of fire incidents - 120 took place in 2003, and the least - 2 in 2006. The data has a decreasing trend.
The average number of yearly fire incidents per 10k residents in Socorro, TX compared to nearest cities:
(Note: Based on data for the last 3 years, including only cities with population 5,000 and above)
| Socorro: | 5.4 |
| San Elizario: | 6.6 |
| Horizon City: | 35.9 |
| Fabens: | 58.5 |
| El Paso: | 9.8 |
| Fort Bliss: | 4.1 |
| Canutillo: | 61.2 |
| Anthony: | 41.8 |
 The median response time based on all reported fire incidents is 8 minutes. This is higher than the state median value.
The median response time in Socorro, TX compared to nearest cities:
(Note: Based on data for all years, including only cities with at least 500 fire incidents)
| Socorro: | 8 minutes |
| Clint: | 10 minutes |
| Horizon City: | 7 minutes |
| El Paso: | 6 minutes |
| Canutillo: | 6 minutes |
| Chaparral: | 8 minutes |
| Anthony: | 12 minutes |
| Las Cruces: | 6 minutes |
| Alamogordo: | 5 minutes |
 28.9% incidents where reported in the morning and 71.1% in the evening. The most fires (16.9%) took place on Wednesday, and the least (12.7%) on Thursday.
 According to the 574 fire incident reports from years 2003 - 2018 most fires (12.7%) took place during June, and the least (4.4%) in September.
 Out of all 2,723 cases reported during the years 2003 - 2018, the most belonged to the categories: Overpressure Rupture (54.9%), Fire (21.1%), and Rescue & EMS (13.3%).
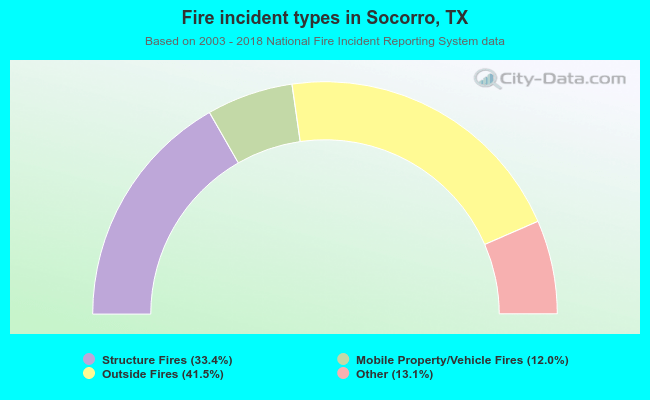 When looking into fire subcategories, the most incidents belonged to: Outside Fires (41.5%), and Structure Fires (33.4%).