Canutillo: Fire Incidents, Texas (TX)
Where are fire incidents reported in Canutillo, TX
Something went wrong! Please refresh the page.
|
| |||||||||||||||||||||||||||||||||||||||||||||||||||||||||||||||||||||||||||||||||||||||||||||||||||||||||||||
2002 - 2018 National Fire Incident Reporting System (NFIRS) incidents
- Incident types reported to NFIRS in Canutillo, TX
- 2,37860.1%Rescue & EMS
- 71918.2%Fire
- 3548.9%Hazardous Condition
- 2225.6%Good Intent Call
- 1453.7%Service Call
- 1082.7%False Alarm
- 240.6%Severe Weather
- 40.1%Overpressure Rupture
- Fire incident types reported to NFIRS in Canutillo, TX
- 46364.4%Outside Fires
- 12517.4%Structure Fires
- 9413.1%Other
- 375.1%Mobile Property/Vehicle Fires
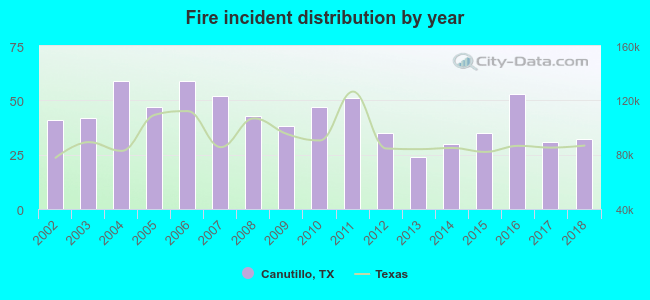 According to the data from the years 2002 - 2018 the average number of fire incidents per year is 42. The highest number of fires - 59 took place in 2004, and the least - 24 in 2013. The data has a declining trend.
The average number of yearly fire incidents per 10k residents in Canutillo, TX compared to nearest cities:
(Note: Based on data for the last 3 years, including only cities with population 5,000 and above)
| Canutillo: | 61.2 |
| Anthony: | 41.8 |
| Fort Bliss: | 4.1 |
| El Paso: | 9.8 |
| Socorro: | 5.4 |
| Horizon City: | 35.9 |
| San Elizario: | 6.6 |
| Fabens: | 58.5 |
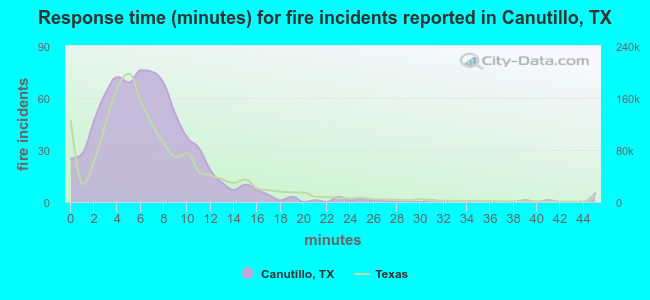 The median response time based on all reported fire incidents is 6 minutes. This is close to the state median value.
The median response time in Canutillo, TX compared to nearest cities:
(Note: Based on data for all years, including only cities with at least 500 fire incidents)
| Canutillo: | 6 minutes |
| Anthony: | 12 minutes |
| Chaparral: | 8 minutes |
| El Paso: | 6 minutes |
| Socorro: | 8 minutes |
| Horizon City: | 7 minutes |
| Las Cruces: | 6 minutes |
| Clint: | 10 minutes |
| Deming: | 7 minutes |
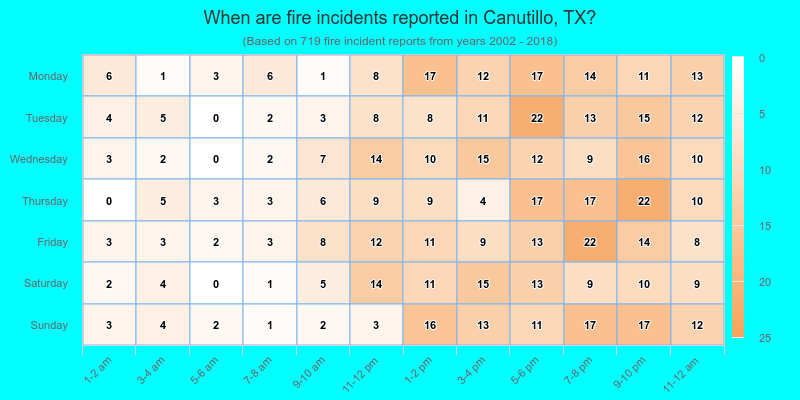
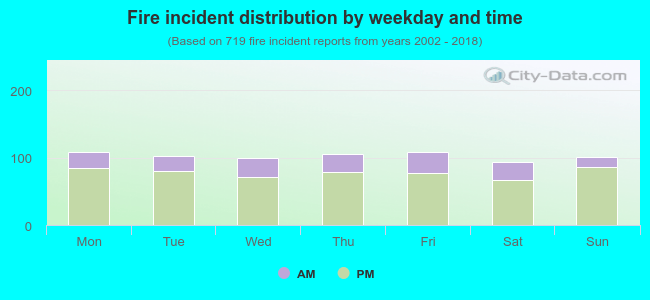 24.1% incidents where reported in the morning and 75.9% in the evening. The most fires (15.2%) took place on Monday, and the least (12.9%) on Saturday.
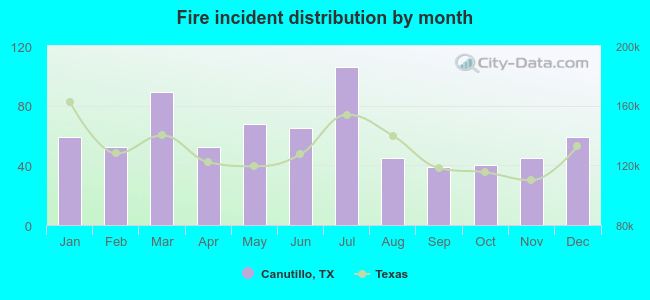 According to the 719 fire incidents from years 2002 - 2018 most fires (14.7%) took place during July, and the least (5.4%) in September.
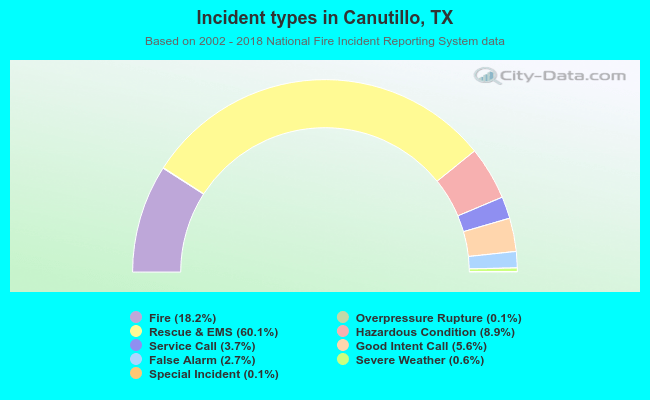 Out of all 3,957 cases reported during the years 2002 - 2018, the most belonged to the categories: Rescue & EMS (60.1%), Fire (18.2%), and Hazardous Condition (8.9%).
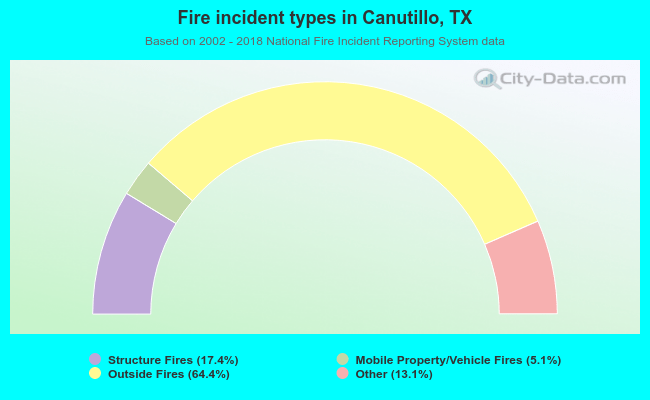 When looking into fire subcategories, the most incidents belonged to: Outside Fires (64.4%), and Structure Fires (17.4%).