Fabens: Fire Incidents, Texas (TX)
Where are fire incidents reported in Fabens, TX
Something went wrong! Please refresh the page.
|
| |||||||||||||||||||||||||||||||||||||||||||||||||||||||||||||||||||||||||||||||||||||||||||||||||||||||||||||
2003 - 2018 National Fire Incident Reporting System (NFIRS) incidents
- Incident types reported to NFIRS in Fabens, TX
- 2,69272.1%Rescue & EMS
- 48813.1%Fire
- 2135.7%Good Intent Call
- 1684.5%Hazardous Condition
- 1102.9%Service Call
- 481.3%False Alarm
- 110.3%Severe Weather
- 40.1%Special Incident
- Fire incident types reported to NFIRS in Fabens, TX
- 20341.6%Outside Fires
- 15130.9%Structure Fires
- 7916.2%Other
- 5511.3%Mobile Property/Vehicle Fires
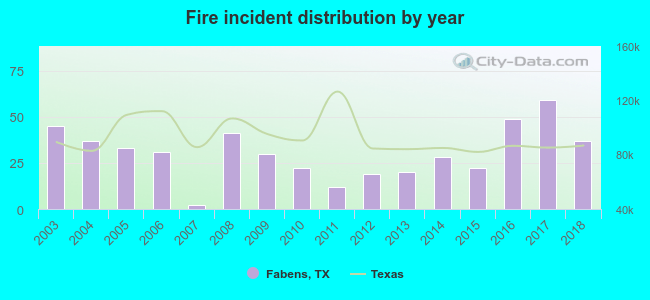 Based on the data from the years 2003 - 2018 the average number of fires per year is 30. The highest number of reported fire incidents - 59 took place in 2017, and the least - 2 in 2007. The data has a declining trend.
The average number of yearly fire incidents per 10k residents in Fabens, TX compared to nearest cities:
(Note: Based on data for the last 3 years, including only cities with population 5,000 and above)
| Fabens: | 58.5 |
| San Elizario: | 6.6 |
| Socorro: | 5.4 |
| Horizon City: | 35.9 |
| El Paso: | 9.8 |
| Fort Bliss: | 4.1 |
| Canutillo: | 61.2 |
| Anthony: | 41.8 |

 33.4% incidents where reported in the morning and 66.6% in the evening. The most fires (16.6%) took place on Saturday, and the least (11.1%) on Wednesday.
 According to the 488 reports from years 2003 - 2018 most fires (10.9%) took place during July, and the least (4.5%) in August.
 Out of all 3,736 cases reported during the years 2003 - 2018, the most belonged to the categories: Rescue & EMS (72.1%), Fire (13.1%), and Good Intent Call (5.7%).
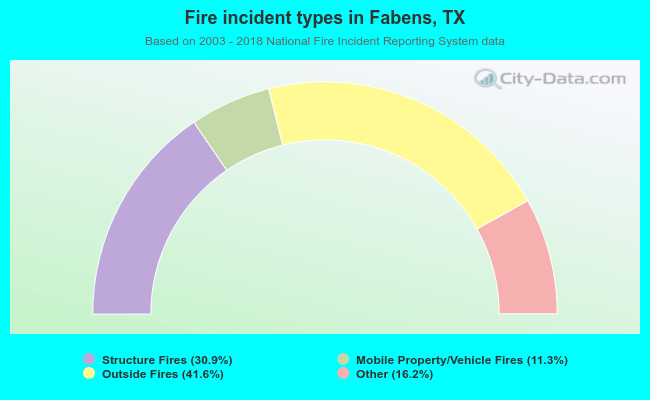 When looking into fire subcategories, the most reports belonged to: Outside Fires (41.6%), and Structure Fires (30.9%).