Prunedale: Fire Incidents, California (CA)
Where are fire incidents reported in Prunedale, CA
Something went wrong! Please refresh the page.
|
| |||||||||||||||||||||||||||||||||||||||||||||||||||||||||||||||||||||||||||||||||||||||||||||||||||||||||||||
2002 - 2018 National Fire Incident Reporting System (NFIRS) incidents
- Incident types reported to NFIRS in Prunedale, CA
- 2,47850.7%Rescue & EMS
- 66713.7%Hazardous Condition
- 66313.6%Good Intent Call
- 52310.7%Fire
- 4188.6%Service Call
- 1232.5%False Alarm
- 60.1%Special Incident
- 50.1%Severe Weather
- Fire incident types reported to NFIRS in Prunedale, CA
- 19737.7%Outside Fires
- 15930.4%Mobile Property/Vehicle Fires
- 14327.3%Structure Fires
- 244.6%Other
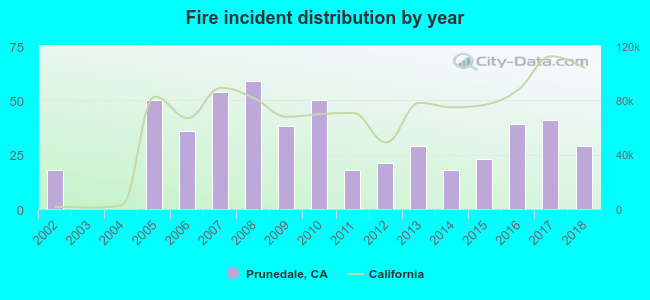 According to the data from the years 2002 - 2018 the average number of fires per year is 31. The highest number of reported fires - 59 took place in 2008, and the least - 0 in 2003. The data has a rising trend.
The average number of yearly fire incidents per 10k residents in Prunedale, CA compared to nearest cities:
(Note: Based on data for the last 3 years, including only cities with population 5,000 and above)
| Prunedale: | 20.7 |
| Castroville: | 43.2 |
| Salinas: | 20.1 |
| Watsonville: | 9.2 |
| Marina: | 29.8 |
| Hollister: | 26.9 |
| Gilroy: | 55.0 |
| Seaside: | 14.8 |
| Aptos: | 38.0 |
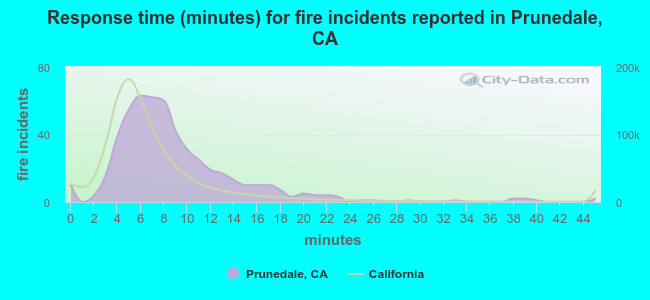 The median response time based on all reported fire incidents is 8 minutes. This is higher than the state median value.
The median response time in Prunedale, CA compared to nearest cities:
(Note: Based on data for all years, including only cities with at least 500 fire incidents)
| Prunedale: | 8 minutes |
| Salinas: | 7 minutes |
| Watsonville: | 11 minutes |
| Marina: | 6 minutes |
| Hollister: | 7 minutes |
| Gilroy: | 7 minutes |
| Seaside: | 4 minutes |
| Aptos: | 7 minutes |
| Monterey: | 4 minutes |
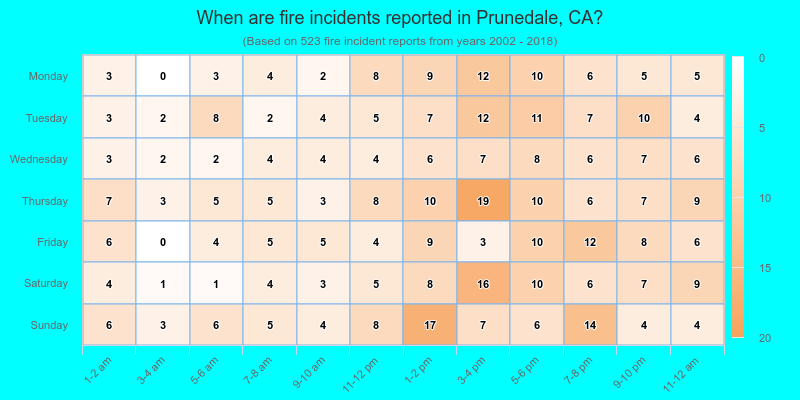
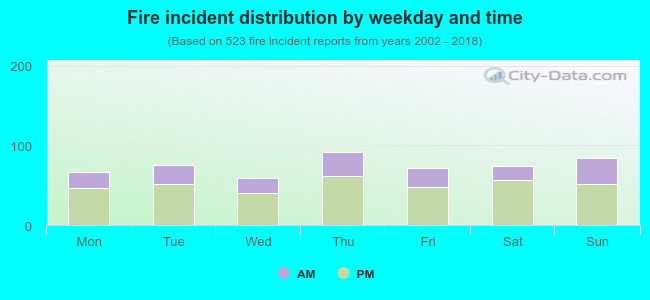 32.1% incidents where reported in the morning and 67.9% in the evening. The most fires (17.6%) took place on Thursday, and the least (11.3%) on Wednesday.
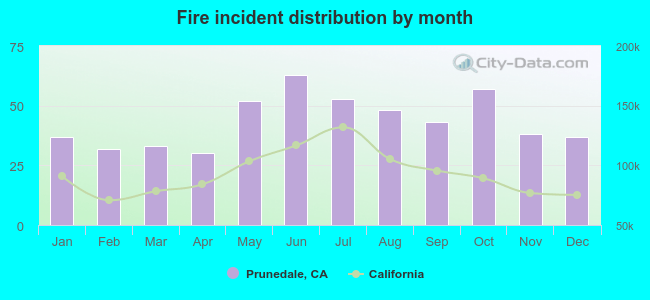 Based on the 523 reports from years 2002 - 2018 most fires (12.0%) took place during June, and the least (5.7%) in April.
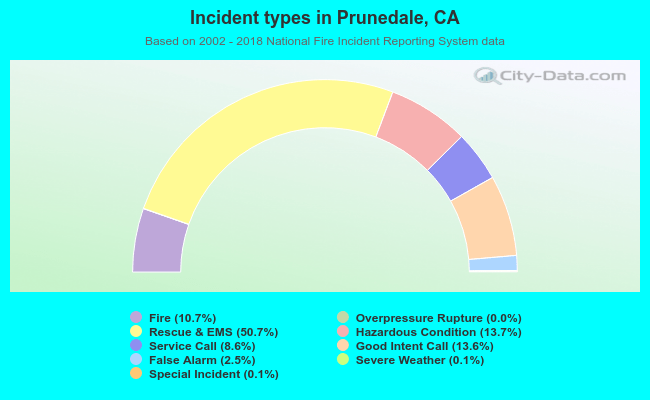 Out of all 4,885 cases reported during the years 2002 - 2018, the most belonged to the categories: Rescue & EMS (50.7%), Hazardous Condition (13.7%), and Good Intent Call (13.6%).
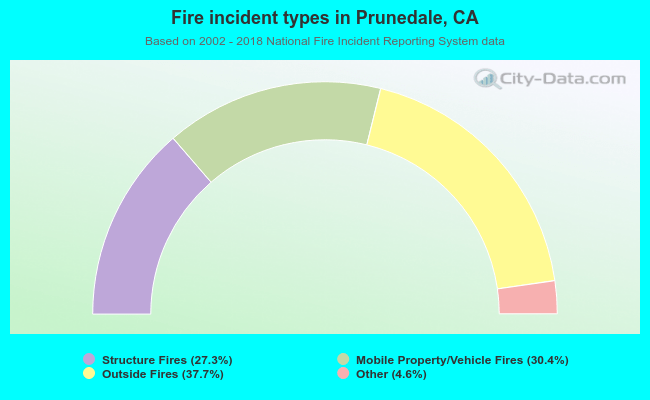 When looking into fire subcategories, the most incidents belonged to: Outside Fires (37.7%), and Mobile Property/Vehicle Fires (30.4%).