Seaside: Fire Incidents, California (CA)
Where are fire incidents reported in Seaside, CA
Something went wrong! Please refresh the page.
| Fire incidents reported | |
|---|---|
| Sreet name | Count |
| FREMONT BLVD | 94 |
| NOCHE BUENA ST | 70 |
| BROADWAY AVE | 58 |
| SONOMA AVE | 52 |
| CANYON DEL REY BLVD | 50 |
| COE AVE | 50 |
| ELM AVE | 38 |
| OTHER | 34 |
| HIGHWAY 1 | 32 |
| YOSEMITE ST | 32 |
| HAMILTON AVE | 26 |
| SAN PABLO AVE | 26 |
| TRINITY AVE | 24 |
| AMADOR AVE | 22 |
| LUXTON ST | 22 |
| PALM AVE | 22 |
| HILBY AVE | 20 |
| DEL MONTE BLVD | 18 |
| FLORES ST | 18 |
| JUDSON ST | 18 |
| MILITARY AVE | 18 |
| SOTO ST | 18 |
| FREMONT | 16 |
| KIMBALL AVE | 16 |
| LA SALLE AVE | 16 |
| LOWELL ST | 16 |
| MESCAL ST | 16 |
| VALLEJO ST | 16 |
| BAKER ST | 14 |
| LUZERN ST | 14 |
2002 - 2018 National Fire Incident Reporting System (NFIRS) incidents
- Incident types reported to NFIRS in Seaside, CA
- 6,07360.6%Rescue & EMS
- 1,11011.1%Hazardous Condition
- 1,08210.8%Service Call
- 8088.1%Fire
- 5505.5%Good Intent Call
- 3563.6%False Alarm
- 310.3%Severe Weather
- Fire incident types reported to NFIRS in Seaside, CA
- 34542.7%Structure Fires
- 25831.9%Outside Fires
- 14718.2%Mobile Property/Vehicle Fires
- 587.2%Other
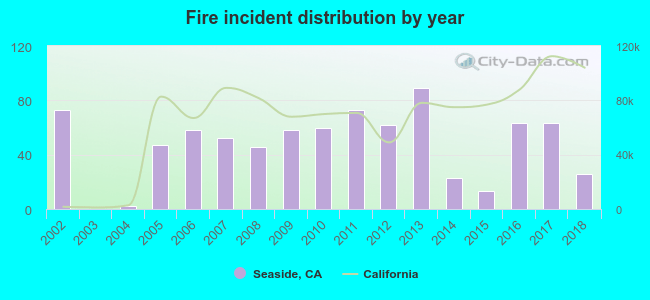 According to the data from the years 2002 - 2018 the average number of fires per year is 48. The highest number of fire incidents - 89 took place in 2013, and the least - 0 in 2003. The data has a declining trend.
The average number of yearly fire incidents per 10k residents in Seaside, CA compared to nearest cities:
(Note: Based on data for the last 3 years, including only cities with population 5,000 and above)
| Seaside: | 14.8 |
| Monterey: | 30.9 |
| Marina: | 29.8 |
| Pacific Grove: | 14.5 |
| Carmel: | 11.7 |
| Castroville: | 43.2 |
| Salinas: | 20.1 |
| Carmel Valley: | 19.7 |
| Prunedale: | 20.7 |
 The median response time based on all reported fire incidents is 4 minutes. This is lower compared to the state median value.
The median response time in Seaside, CA compared to nearest cities:
(Note: Based on data for all years, including only cities with at least 500 fire incidents)
| Seaside: | 4 minutes |
| Monterey: | 4 minutes |
| Marina: | 6 minutes |
| Salinas: | 7 minutes |
| Prunedale: | 8 minutes |
| Watsonville: | 11 minutes |
| Aptos: | 7 minutes |
| Live Oak: | 6 minutes |
| Santa Cruz: | 6 minutes |
 According to the reports from the years 2002 - 2018 the average number of fire-related casualties per year is 1. The highest number of casualties - 7 took place in 2002, and the lowest - 0 in 2003. The data has a dropping trend.
The average number of casualties per 1,000 fires is 20. This indicator was the highest - 96 in 2002, and the lowest 0 in 2003. The trend for casualties per 1,000 incidents is declining. Compared to the state value the number of injuries per 1,000 fires is much higher.
According to the reports from the years 2002 - 2018 the average number of fire-related casualties per year is 1. The highest number of casualties - 7 took place in 2002, and the lowest - 0 in 2003. The data has a dropping trend.
The average number of casualties per 1,000 fires is 20. This indicator was the highest - 96 in 2002, and the lowest 0 in 2003. The trend for casualties per 1,000 incidents is declining. Compared to the state value the number of injuries per 1,000 fires is much higher.Casualties per 1,000 incidents in Seaside, CA compared to nearest cities:
(Note: Based on data for all years, including only cities with at least 500 fire incidents)
| Seaside: | 27.2 |
| Monterey: | 12.7 |
| Marina: | 19.9 |
| Salinas: | 5.9 |
| Prunedale: | 3.8 |
| Watsonville: | 2.4 |
| Aptos: | 12.8 |
| Live Oak: | 9.0 |
| Santa Cruz: | 11.8 |
 34.2% incidents where reported in the morning and 65.8% in the evening. The most fires (15.3%) took place on Sunday, and the least (12.0%) on Thursday.
 According to the 808 fire incidents from years 2002 - 2018 most fires (10.9%) took place during July, and the least (5.9%) in November.
 Out of all 10,018 cases reported during the years 2002 - 2018, the most belonged to the categories: Rescue & EMS (60.6%), Hazardous Condition (11.1%), and Service Call (10.8%).
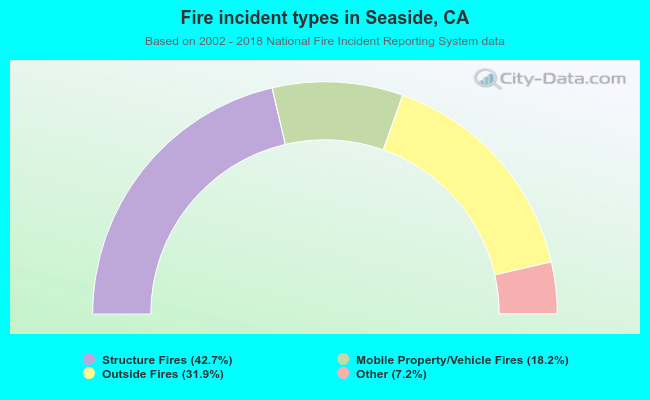 When looking into fire subcategories, the most incidents belonged to: Structure Fires (42.7%), and Outside Fires (31.9%).