Gilroy: Fire Incidents, California (CA)
Where are fire incidents reported in Gilroy, CA
Something went wrong! Please refresh the page.
| Fire incidents reported | |
|---|---|
| Sreet name | Count |
| MONTEREY ST | 288 |
| CHURCH ST | 180 |
| FIRST ST | 140 |
| CAMINO ARROYO | 112 |
| HWY 101 | 106 |
| TENTH ST | 104 |
| MONTEREY RD | 100 |
| PACHECO PASS HY | 98 |
| SIXTH ST | 96 |
| LEAVESLEY RD | 94 |
| LEWIS ST | 86 |
| MILLER AV | 86 |
| PACHECO PASS | 84 |
| CHESTNUT ST | 76 |
| 101 | 68 |
| HANNA ST | 66 |
| MANTELLI DR | 66 |
| MURRAY AV | 62 |
| SANTA TERESA BL | 62 |
| ROSANNA ST | 60 |
| MURRAY | 58 |
| FOREST ST | 56 |
| HWY 152 | 56 |
| MONTE BELLO DR | 56 |
| MILLER | 54 |
| SANTA TERESA | 54 |
| THIRD ST | 54 |
| WESTWOOD DR | 46 |
| ALEXANDER ST | 44 |
| CARMEL ST | 44 |
| Other | 535 |
2005 - 2018 National Fire Incident Reporting System (NFIRS) incidents
- Incident types reported to NFIRS in Gilroy, CA
- 14,36758.9%Rescue & EMS
- 3,09112.7%Fire
- 2,65910.9%Good Intent Call
- 1,8257.5%Service Call
- 1,1514.7%False Alarm
- 1,1244.6%Hazardous Condition
- 1180.5%Special Incident
- 420.2%Severe Weather
- Fire incident types reported to NFIRS in Gilroy, CA
- 1,38944.9%Outside Fires
- 1,08635.1%Structure Fires
- 47515.4%Mobile Property/Vehicle Fires
- 1414.6%Other
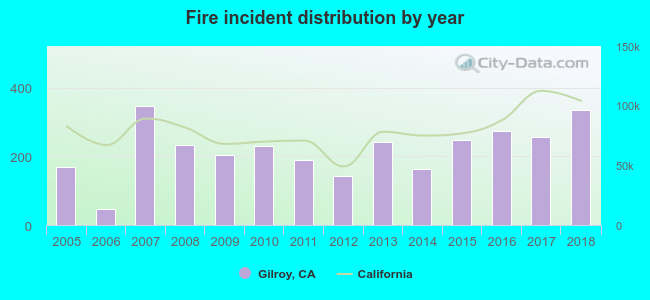 Based on the data from the years 2005 - 2018 the average number of fire incidents per year is 221. The highest number of fires - 348 took place in 2007, and the least - 48 in 2006. The data has a rising trend.
The average number of yearly fire incidents per 10k residents in Gilroy, CA compared to nearest cities:
(Note: Based on data for the last 3 years, including only cities with population 5,000 and above)
| Gilroy: | 55.0 |
| San Martin: | 13.8 |
| Morgan Hill: | 4.1 |
| Watsonville: | 9.2 |
| Hollister: | 26.9 |
| Prunedale: | 20.7 |
| Aptos: | 38.0 |
| Castroville: | 43.2 |
| Soquel: | 20.7 |
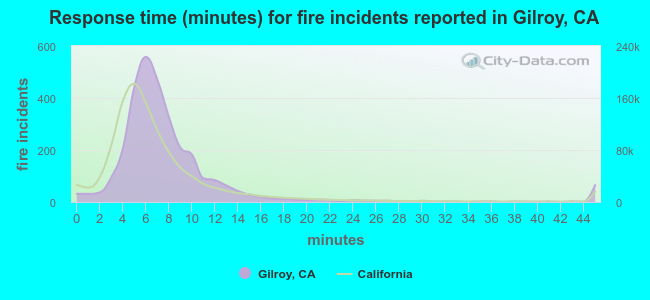 The median response time based on all reported fire incidents is 7 minutes. This is similar to the state median value.
The median response time in Gilroy, CA compared to nearest cities:
(Note: Based on data for all years, including only cities with at least 500 fire incidents)
| Gilroy: | 7 minutes |
| Morgan Hill: | 6 minutes |
| Watsonville: | 11 minutes |
| Hollister: | 7 minutes |
| Prunedale: | 8 minutes |
| Aptos: | 7 minutes |
| Live Oak: | 6 minutes |
| Salinas: | 7 minutes |
| Scotts Valley: | 7 minutes |
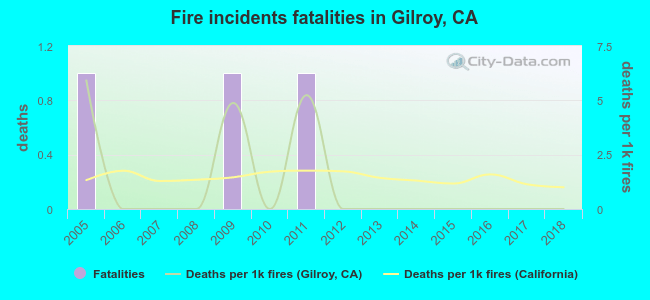 According to the data from the years 2005 - 2018 the average number of fire-related fatalities per year is 0. The highest number of deaths - 1 took place in 2005, and the lowest - 0 in 2006. The data has a decreasing trend.
The average number of deaths per 1,000 fire incidents is 1. This indicator was the highest - 6 in 2005, and the lowest 0 in 2006. The trend for fatalities per 1,000 fires is declining. Compared to the California value the number of deaths per 1,000 fire incidents is lower.
According to the data from the years 2005 - 2018 the average number of fire-related fatalities per year is 0. The highest number of deaths - 1 took place in 2005, and the lowest - 0 in 2006. The data has a decreasing trend.
The average number of deaths per 1,000 fire incidents is 1. This indicator was the highest - 6 in 2005, and the lowest 0 in 2006. The trend for fatalities per 1,000 fires is declining. Compared to the California value the number of deaths per 1,000 fire incidents is lower.Deaths per 1,000 incidents in Gilroy, CA compared to nearest cities:
(Note: Based on data for all years, including only cities with at least 2,500 fire incidents)
| Gilroy: | 1.0 |
| San Jose: | 1.2 |
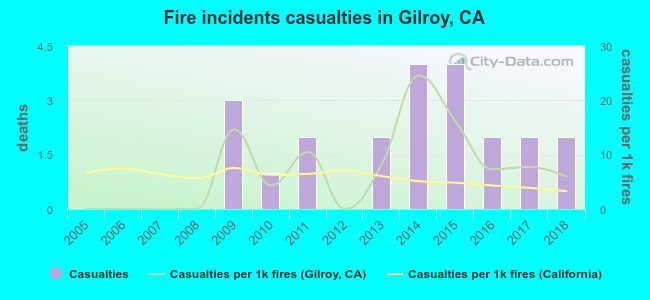 According to the data from the years 2005 - 2018 the average number of fire-related yearly casualties is 2. The highest number of casualties - 4 took place in 2014, and the lowest - 0 in 2005. The data has a rising trend.
The average number of casualties per 1,000 fires is 7. This indicator was the highest - 25 in 2014, and the lowest 0 in 2005. The trend for casualties per 1,000 fires is rising. Compared to the California value the number of injuries per 1,000 incidents is higher.
According to the data from the years 2005 - 2018 the average number of fire-related yearly casualties is 2. The highest number of casualties - 4 took place in 2014, and the lowest - 0 in 2005. The data has a rising trend.
The average number of casualties per 1,000 fires is 7. This indicator was the highest - 25 in 2014, and the lowest 0 in 2005. The trend for casualties per 1,000 fires is rising. Compared to the California value the number of injuries per 1,000 incidents is higher.Casualties per 1,000 incidents in Gilroy, CA compared to nearest cities:
(Note: Based on data for all years, including only cities with at least 500 fire incidents)
| Gilroy: | 7.1 |
| Morgan Hill: | 14.2 |
| Watsonville: | 2.4 |
| Hollister: | 8.4 |
| Prunedale: | 3.8 |
| Aptos: | 12.8 |
| Live Oak: | 9.0 |
| Salinas: | 5.9 |
| Scotts Valley: | 7.0 |
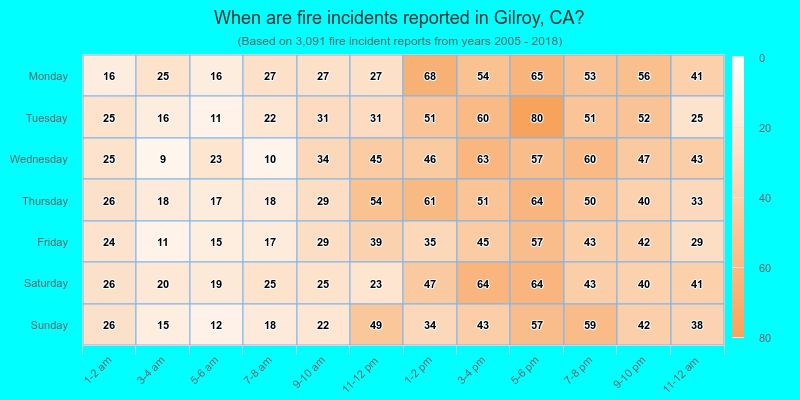
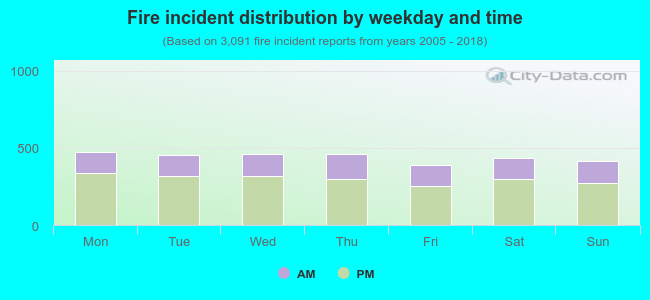 32.3% incidents where reported in the morning and 67.7% in the evening. The most fires (15.4%) took place on Monday, and the least (12.5%) on Friday.
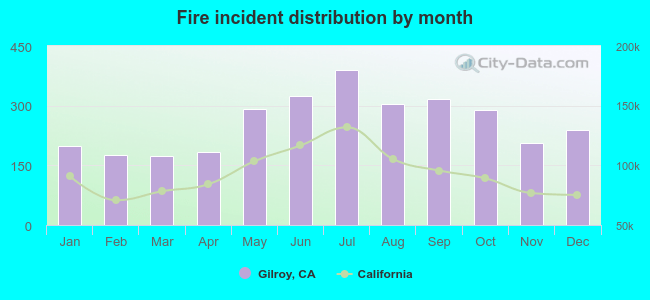 Based on the 3,091 fire incidents from years 2005 - 2018 most fires (12.6%) took place during July, and the least (5.6%) in March.
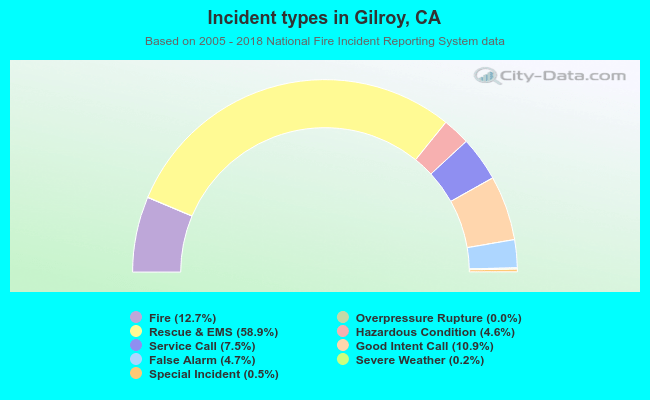 Out of all 24,388 cases reported during the years 2005 - 2018, the most belonged to the categories: Rescue & EMS (58.9%), Fire (12.7%), and Good Intent Call (10.9%).
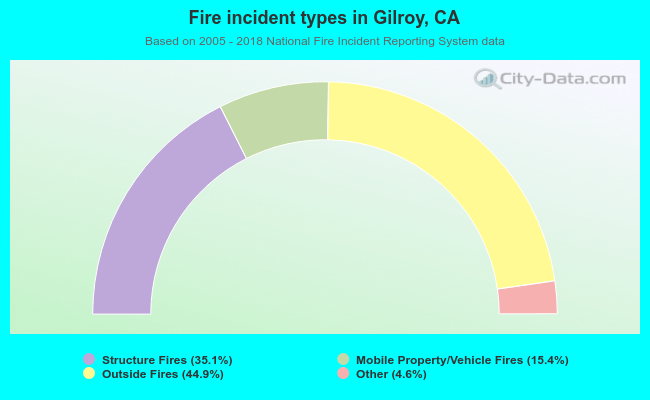 When looking into fire subcategories, the most reports belonged to: Outside Fires (44.9%), and Structure Fires (35.1%).