Lake Havasu City: Fire Incidents, Arizona (AZ)
Where are fire incidents reported in Lake Havasu City, AZ
Something went wrong! Please refresh the page.
| Fire incidents reported | |
|---|---|
| Sreet name | Count |
| MCCULLOCH BLVD | 282 |
| BEACHCOMBER BLVD | 172 |
| LAKE HAVASU AVE | 150 |
| HIGHWAY 95 | 138 |
| ACOMA BLVD | 136 |
| LONDON BRIDGE RD | 132 |
| SWANSON AVE | 108 |
| KIOWA AVE | 76 |
| PALO VERDE BLVD | 74 |
| SMOKETREE AVE | 68 |
| JAMAICA BLVD | 64 |
| KIOWA BLVD | 56 |
| KEARSAGE DR | 50 |
| INDUSTRIAL BLVD | 44 |
| MESQUITE AVE | 44 |
| DAYTONA AVE | 38 |
| PARK AVE | 38 |
| HIGHWAY 95 HWY | 36 |
| PALISADES DR | 30 |
| SARATOGA AVE | 30 |
| HAVASUPAI BLVD | 28 |
| COLT DR | 26 |
| MARICOPA AVE | 26 |
| EL DORADO AVE | 24 |
| GAUGE DR | 24 |
| MM SR95 | 24 |
| ORO GRANDE BLVD | 24 |
| CHEMEHUEVI BLVD | 22 |
| DESERT HILLS | 22 |
| MULBERRY AVE | 22 |
| Other | 289 |
2002 - 2018 National Fire Incident Reporting System (NFIRS) incidents
- Incident types reported to NFIRS in Lake Havasu City, AZ
- 24,64860.4%Rescue & EMS
- 6,07214.9%Service Call
- 3,2417.9%Good Intent Call
- 2,4516.0%Hazardous Condition
- 2,2975.6%Fire
- 2,0215.0%False Alarm
- Fire incident types reported to NFIRS in Lake Havasu City, AZ
- 1,01144.0%Outside Fires
- 63727.7%Mobile Property/Vehicle Fires
- 61126.6%Structure Fires
- 381.7%Other
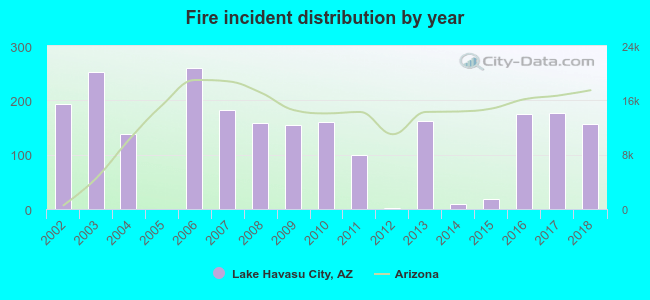 According to the data from the years 2002 - 2018 the average number of fires per year is 135. The highest number of reported fires - 259 took place in 2006, and the least - 0 in 2005. The data has a declining trend.
The average number of yearly fire incidents per 10k residents in Lake Havasu City, AZ compared to nearest cities:
(Note: Based on data for the last 3 years, including only cities with population 5,000 and above)
| Lake Havasu City: | 31.9 |
| Fort Mohave: | 36.4 |
| Bullhead City: | 21.4 |
| Golden Valley: | 24.3 |
| Kingman: | 81.3 |
| Wickenburg: | 41.4 |
| Prescott: | 20.8 |
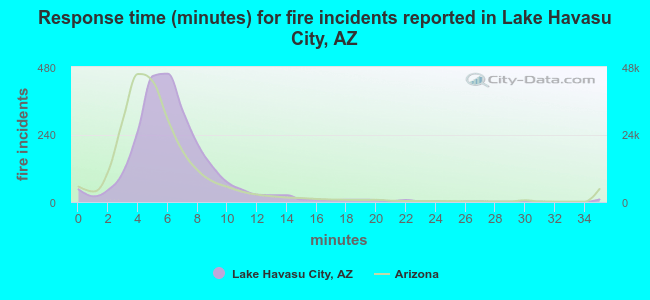 The median response time based on all reported fire incidents is 6 minutes. This is about the same as the Arizona median value.
The median response time in Lake Havasu City, AZ compared to nearest cities:
(Note: Based on data for all years, including only cities with at least 500 fire incidents)
| Lake Havasu City: | 6 minutes |
| Mohave Valley: | 7 minutes |
| Bullhead City: | 5 minutes |
| Golden Valley: | 10 minutes |
| Kingman: | 5 minutes |
| Tonopah: | 11 minutes |
| Prescott: | 6 minutes |
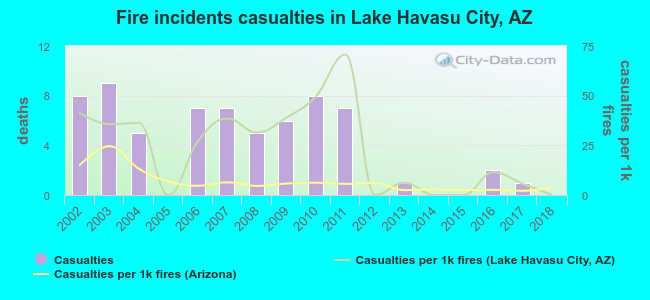 Based on the reports from the years 2002 - 2018 the average number of fire-related yearly casualties is 4. The highest number of reported injuries - 9 took place in 2003, and the lowest - 0 in 2005. The data has a decreasing trend.
The average number of casualties per 1,000 fire incidents is 23. This indicator was the highest - 71 in 2011, and the lowest 0 in 2005. The trend for casualties per 1,000 incidents is declining. Compared to the Arizona value the number of casualties per 1,000 incidents is much higher.
Based on the reports from the years 2002 - 2018 the average number of fire-related yearly casualties is 4. The highest number of reported injuries - 9 took place in 2003, and the lowest - 0 in 2005. The data has a decreasing trend.
The average number of casualties per 1,000 fire incidents is 23. This indicator was the highest - 71 in 2011, and the lowest 0 in 2005. The trend for casualties per 1,000 incidents is declining. Compared to the Arizona value the number of casualties per 1,000 incidents is much higher.Casualties per 1,000 incidents in Lake Havasu City, AZ compared to nearest cities:
(Note: Based on data for all years, including only cities with at least 500 fire incidents)
| Lake Havasu City: | 28.7 |
| Mohave Valley: | 16.8 |
| Bullhead City: | 33.9 |
| Golden Valley: | 7.3 |
| Kingman: | 6.9 |
| Tonopah: | 1.3 |
| Prescott: | 0.0 |
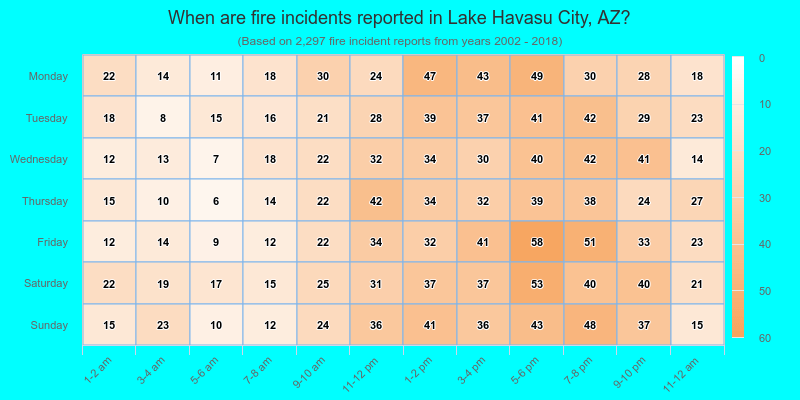
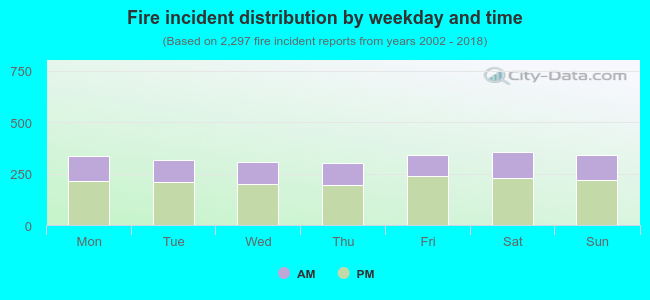 34.4% incidents where reported in the morning and 65.6% in the evening. The most fires (15.5%) took place on Saturday, and the least (13.2%) on Thursday.
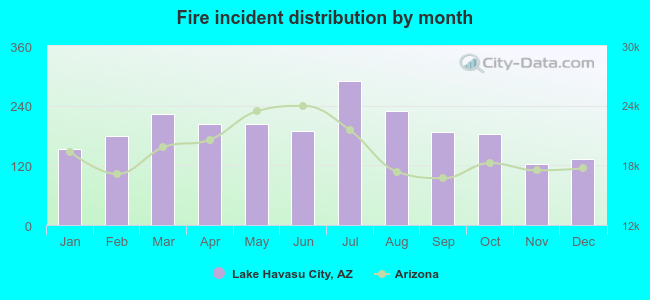 According to the 2,297 fire incidents from years 2002 - 2018 most fires (12.6%) took place during July, and the least (5.3%) in November.
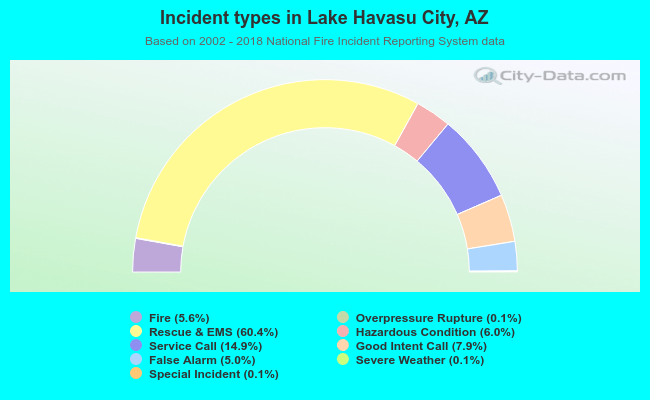 Out of all 40,827 cases reported during the years 2002 - 2018, the most belonged to the categories: Rescue & EMS (60.4%), Service Call (14.9%), and Good Intent Call (7.9%).
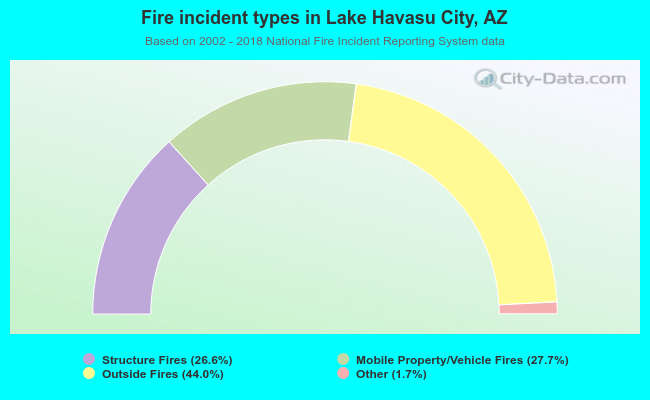 When looking into fire subcategories, the most reports belonged to: Outside Fires (44.0%), and Mobile Property/Vehicle Fires (27.7%).