Kingman: Fire Incidents, Arizona (AZ)
Where are fire incidents reported in Kingman, AZ
Something went wrong! Please refresh the page.
| Fire incidents reported | |
|---|---|
| Sreet name | Count |
| STOCKTON HILL RD | 402 |
| ANDY DEVINE AVE | 394 |
| BEALE ST | 138 |
| INTERSTATE 40 | 132 |
| HARRISON ST | 108 |
| AIRWAY AVE | 104 |
| BEVERLY AVE | 84 |
| KINO AVE | 56 |
| HUALAPAI MOUNTAIN RD | 54 |
| WILLOW RD | 52 |
| NORTHERN | 46 |
| NORTHFIELD AVE | 46 |
| GORDON DR | 44 |
| BANK ST | 40 |
| CASTLE ROCK RD | 40 |
| DETROIT AVE | 40 |
| BANK | 34 |
| HIGHWAY 66 | 34 |
| JOHN L AVE | 34 |
| ROOSEVELT ST | 34 |
| DEVLIN | 32 |
| DEVLIN AVE | 32 |
| NORTHFIELD | 32 |
| SUNSHINE DR | 32 |
| WESTERN AVE | 30 |
| IRVING ST | 26 |
| NEAL AVE | 26 |
| NORTHERN AVE | 26 |
| SYCAMORE AVE | 26 |
| EASTERN ST | 24 |
| Other | 405 |
2003 - 2018 National Fire Incident Reporting System (NFIRS) incidents
- Incident types reported to NFIRS in Kingman, AZ
- 26,45760.9%Rescue & EMS
- 6,20514.3%Service Call
- 5,13411.8%Good Intent Call
- 2,6076.0%Fire
- 1,4673.4%Hazardous Condition
- 1,2722.9%False Alarm
- 3060.7%Special Incident
- Fire incident types reported to NFIRS in Kingman, AZ
- 1,44855.5%Outside Fires
- 53420.5%Structure Fires
- 44317.0%Mobile Property/Vehicle Fires
- 1827.0%Other
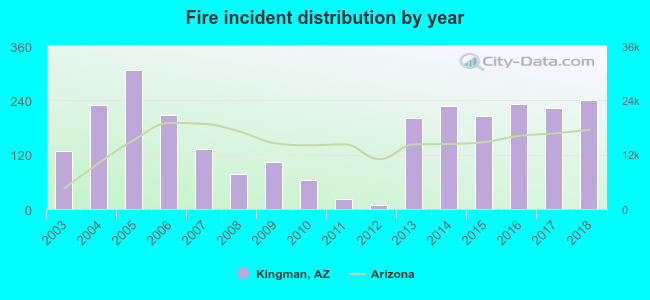 According to the data from the years 2003 - 2018 the average number of fires per year is 163. The highest number of reported fires - 306 took place in 2005, and the least - 8 in 2012. The data has a rising trend.
The average number of yearly fire incidents per 10k residents in Kingman, AZ compared to nearest cities:
(Note: Based on data for the last 3 years, including only cities with population 5,000 and above)
| Kingman: | 81.3 |
| Golden Valley: | 24.3 |
| Bullhead City: | 21.4 |
| Fort Mohave: | 36.4 |
| Lake Havasu City: | 31.9 |
| Paulden: | 3.8 |
| Chino Valley: | 15.4 |
| Prescott: | 20.8 |
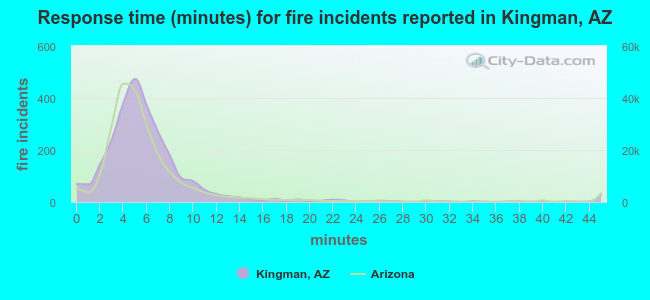 The median response time based on all reported fire incidents is 5 minutes. This is about the same as the Arizona median value.
The median response time in Kingman, AZ compared to nearest cities:
(Note: Based on data for all years, including only cities with at least 500 fire incidents)
| Kingman: | 5 minutes |
| Golden Valley: | 10 minutes |
| Bullhead City: | 5 minutes |
| Mohave Valley: | 7 minutes |
| Lake Havasu City: | 6 minutes |
| Prescott: | 6 minutes |
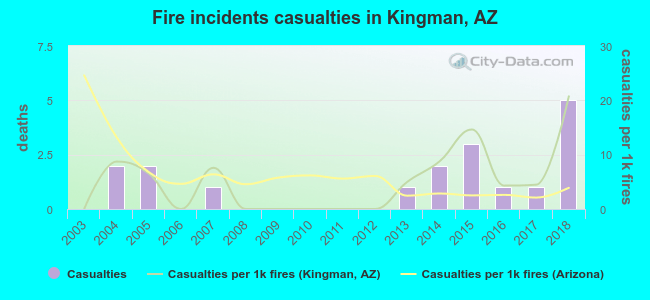 Based on the reports from the years 2003 - 2018 the average number of fire-related yearly casualties is 1. The highest number of reported injuries - 5 took place in 2018, and the lowest - 0 in 2003. The data has an increasing trend.
The average number of casualties per 1,000 fire incidents is 5. This indicator was the highest - 21 in 2018, and the lowest 0 in 2003. The trend for casualties per 1,000 incidents is rising. Compared to the Arizona value the number of casualties per 1,000 incidents is higher.
Based on the reports from the years 2003 - 2018 the average number of fire-related yearly casualties is 1. The highest number of reported injuries - 5 took place in 2018, and the lowest - 0 in 2003. The data has an increasing trend.
The average number of casualties per 1,000 fire incidents is 5. This indicator was the highest - 21 in 2018, and the lowest 0 in 2003. The trend for casualties per 1,000 incidents is rising. Compared to the Arizona value the number of casualties per 1,000 incidents is higher.Casualties per 1,000 incidents in Kingman, AZ compared to nearest cities:
(Note: Based on data for all years, including only cities with at least 500 fire incidents)
| Kingman: | 6.9 |
| Golden Valley: | 7.3 |
| Bullhead City: | 33.9 |
| Mohave Valley: | 16.8 |
| Lake Havasu City: | 28.7 |
| Prescott: | 0.0 |
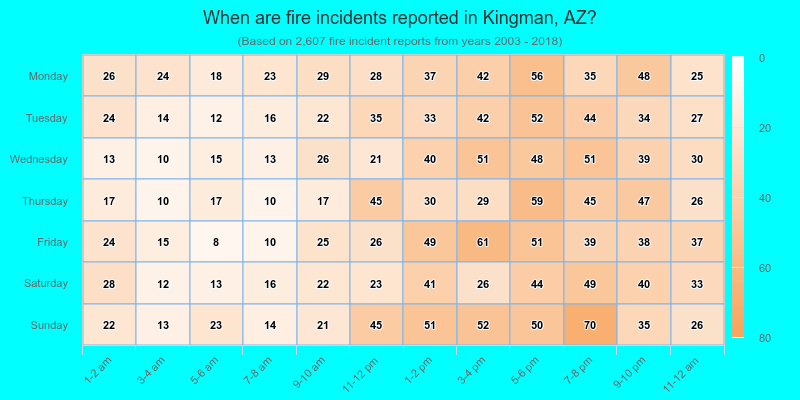
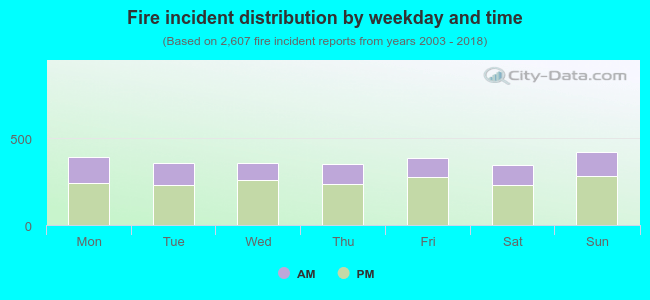 32.4% incidents where reported in the morning and 67.6% in the evening. The most fires (16.2%) took place on Sunday, and the least (13.3%) on Saturday.
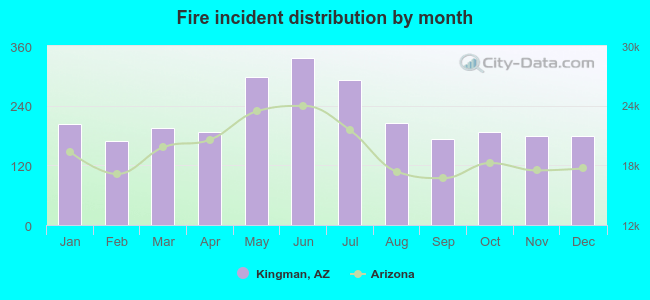 According to the 2,607 fire incidents from years 2003 - 2018 most fires (12.9%) took place during June, and the least (6.5%) in February.
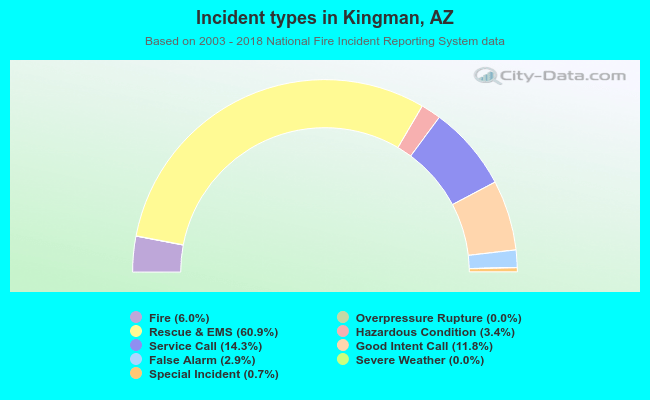 Out of all 43,473 cases reported during the years 2003 - 2018, the most belonged to the categories: Rescue & EMS (60.9%), Service Call (14.3%), and Good Intent Call (11.8%).
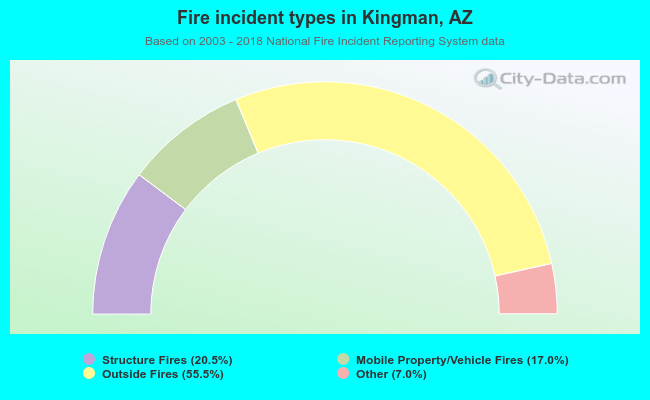 When looking into fire subcategories, the most reports belonged to: Outside Fires (55.5%), and Structure Fires (20.5%).