Fort Mohave: Fire Incidents, Arizona (AZ)
Where are fire incidents reported in Fort Mohave, AZ
Something went wrong! Please refresh the page.
|
| |||||||||||||||||||||||||||||||||||||||||||||||||||||||||||||||||||||||||||||||||||||||||||||||||||||||||||||
| Other | 5 | |||||||||||||||||||||||||||||||||||||||||||||||||||||||||||||||||||||||||||||||||||||||||||||||||||||||||||||
2003 - 2018 National Fire Incident Reporting System (NFIRS) incidents
- Incident types reported to NFIRS in Fort Mohave, AZ
- 7,05379.1%Rescue & EMS
- 7938.9%Service Call
- 4204.7%False Alarm
- 3063.4%Good Intent Call
- 2572.9%Fire
- 700.8%Hazardous Condition
- 100.1%Special Incident
- Fire incident types reported to NFIRS in Fort Mohave, AZ
- 10540.9%Structure Fires
- 9436.6%Outside Fires
- 3614.0%Mobile Property/Vehicle Fires
- 228.6%Other
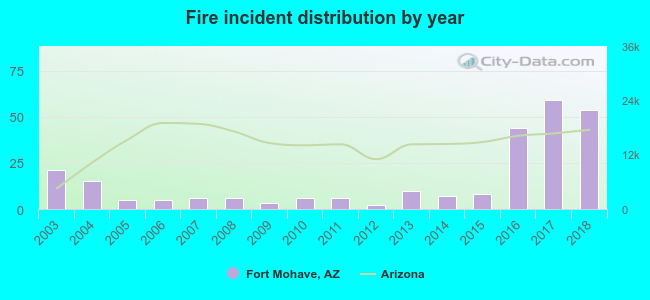 Based on the data from the years 2003 - 2018 the average number of fires per year is 16. The highest number of fire incidents - 59 took place in 2017, and the least - 2 in 2012. The data has a growing trend.
The average number of yearly fire incidents per 10k residents in Fort Mohave, AZ compared to nearest cities:
(Note: Based on data for the last 3 years, including only cities with population 5,000 and above)
| Fort Mohave: | 36.4 |
| Bullhead City: | 21.4 |
| Golden Valley: | 24.3 |
| Kingman: | 81.3 |
| Lake Havasu City: | 31.9 |
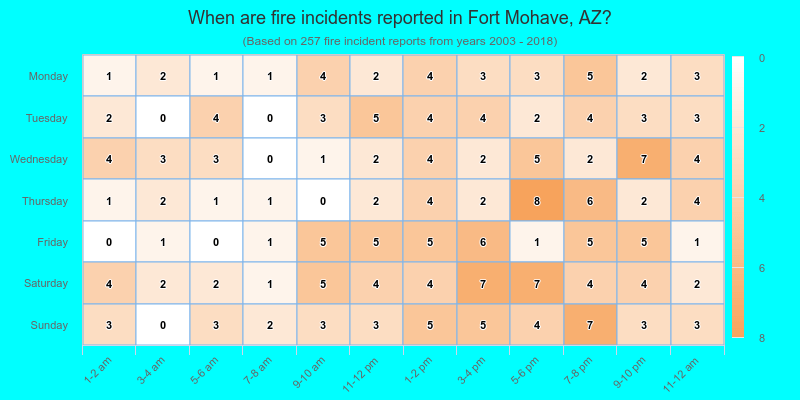
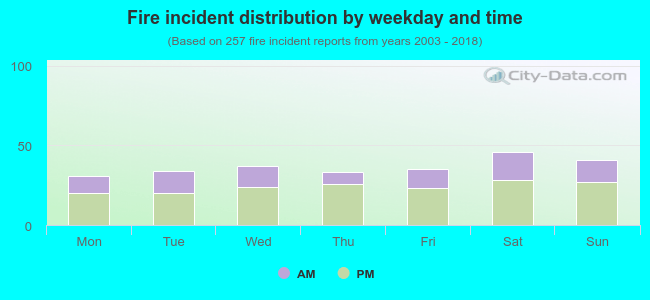 34.6% incidents where reported in the morning and 65.4% in the evening. The most fires (17.9%) took place on Saturday, and the least (12.1%) on Monday.
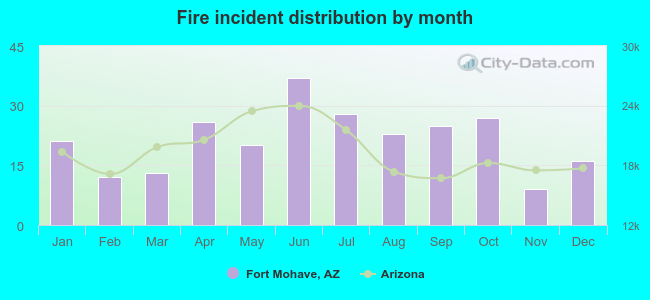 Based on the 257 fire incident reports from years 2003 - 2018 most fires (14.4%) took place during June, and the least (3.5%) in November.
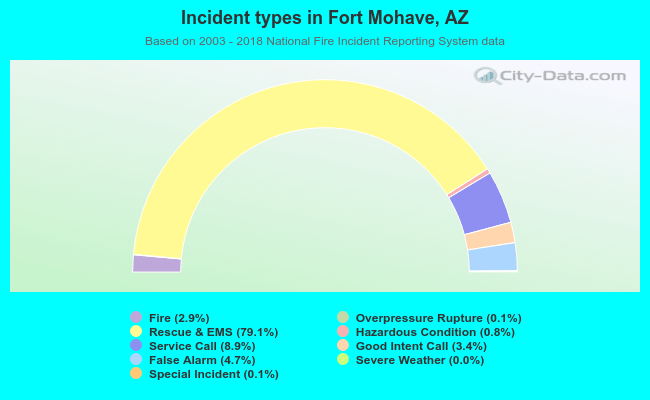 Out of all 8,918 cases reported during the years 2003 - 2018, the most belonged to the categories: Rescue & EMS (79.1%), Service Call (8.9%), and False Alarm (4.7%).
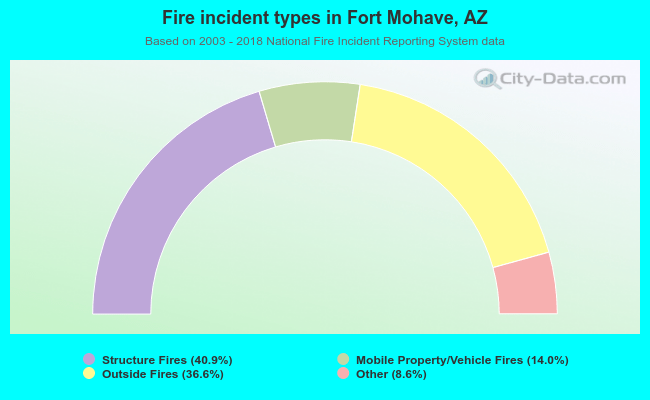 When looking into fire subcategories, the most reports belonged to: Structure Fires (40.9%), and Outside Fires (36.6%).