Hales Corners: Fire Incidents, Wisconsin (WI)
Where are fire incidents reported in Hales Corners, WI
Something went wrong! Please refresh the page.
|
| |||||||||||||||||||||||||||||||||||||||||||||||||||||||||||||||||||||||||||||||||||||||||||||||||||||||||||||
2002 - 2018 National Fire Incident Reporting System (NFIRS) incidents
- Incident types reported to NFIRS in Hales Corners, WI
- 54632.5%Hazardous Condition
- 32619.4%Fire
- 32019.0%Rescue & EMS
- 24514.6%False Alarm
- 1207.1%Service Call
- 1056.2%Good Intent Call
- 80.5%Severe Weather
- 70.4%Special Incident
- 50.3%Overpressure Rupture
- Fire incident types reported to NFIRS in Hales Corners, WI
- 19760.4%Structure Fires
- 6319.3%Outside Fires
- 4714.4%Mobile Property/Vehicle Fires
- 195.8%Other
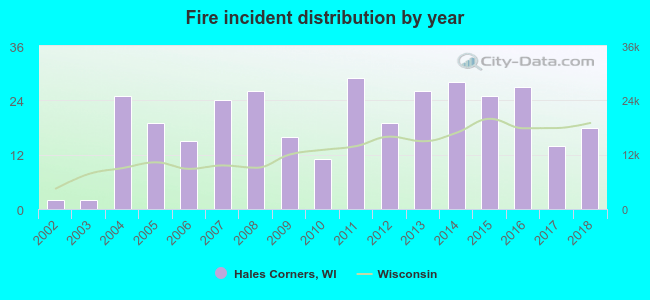 According to the data from the years 2002 - 2018 the average number of fires per year is 19. The highest number of reported fires - 29 took place in 2011, and the least - 2 in 2002. The data has a growing trend.
The average number of yearly fire incidents per 10k residents in Hales Corners, WI compared to nearest cities:
(Note: Based on data for the last 3 years, including only cities with population 5,000 and above)
| Hales Corners: | 25.4 |
| Greendale: | 17.0 |
| Greenfield: | 14.3 |
| Franklin: | 22.7 |
| New Berlin: | 28.9 |
| Muskego: | 17.2 |
| West Allis: | 18.9 |
| Elm Grove: | 13.0 |
| Wauwatosa: | 16.1 |
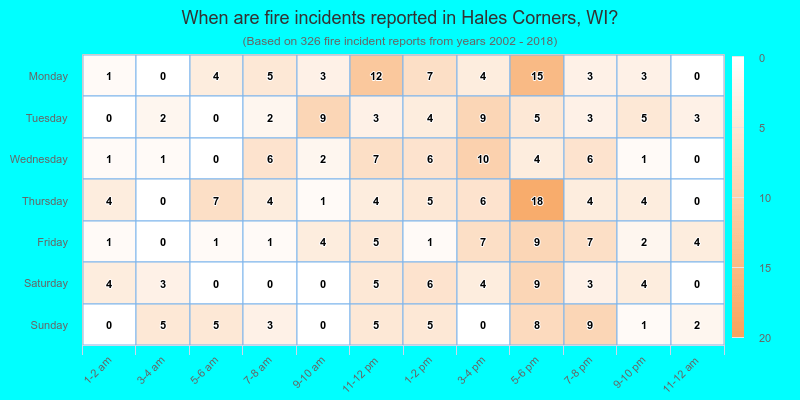
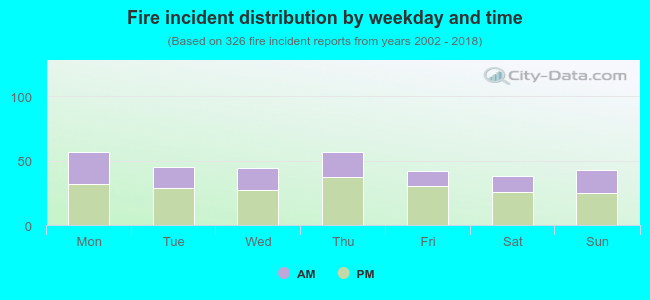 36.8% incidents where reported in the morning and 63.2% in the evening. The most fires (17.5%) took place on Monday, and the least (11.7%) on Saturday.
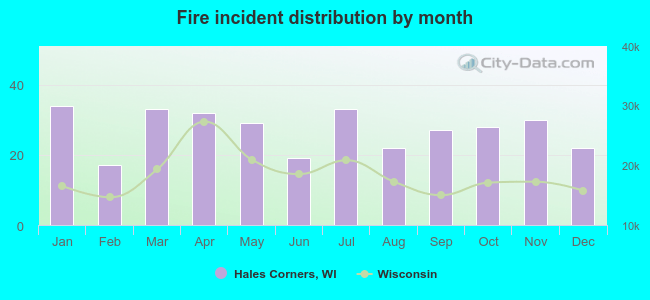 Based on the 326 incident reports from years 2002 - 2018 most fires (10.4%) took place during January, and the least (5.2%) in February.
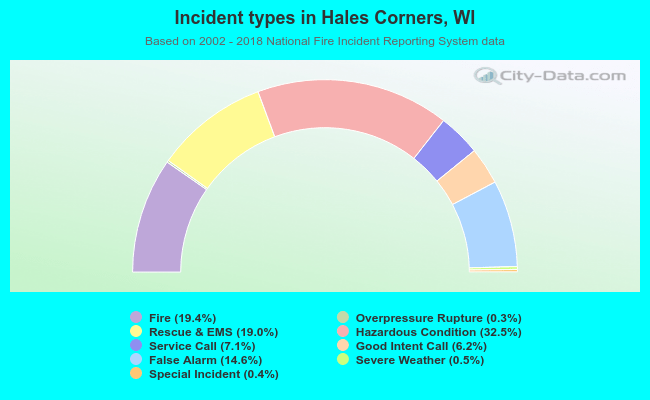 Out of all 1,682 cases reported during the years 2002 - 2018, the most belonged to the categories: Hazardous Condition (32.5%), Fire (19.4%), and Rescue & EMS (19.0%).
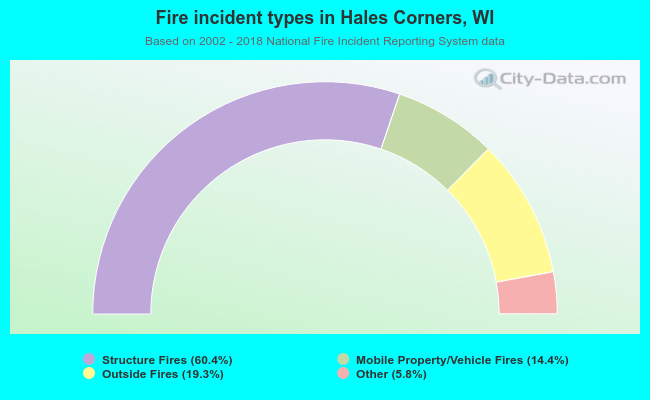 When looking into fire subcategories, the most incidents belonged to: Structure Fires (60.4%), and Outside Fires (19.3%).