Greenfield: Fire Incidents, Wisconsin (WI)
Where are fire incidents reported in Greenfield, WI
Something went wrong! Please refresh the page.
|
| |||||||||||||||||||||||||||||||||||||||||||||||||||||||||||||||||||||||||||||||||||||||||||||||||||||||||||||
2002 - 2018 National Fire Incident Reporting System (NFIRS) incidents
- Incident types reported to NFIRS in Greenfield, WI
- 9,62079.4%Rescue & EMS
- 7596.3%False Alarm
- 5004.1%Fire
- 4713.9%Hazardous Condition
- 3923.2%Service Call
- 3653.0%Good Intent Call
- Fire incident types reported to NFIRS in Greenfield, WI
- 29859.6%Structure Fires
- 8717.4%Mobile Property/Vehicle Fires
- 8617.2%Outside Fires
- 295.8%Other
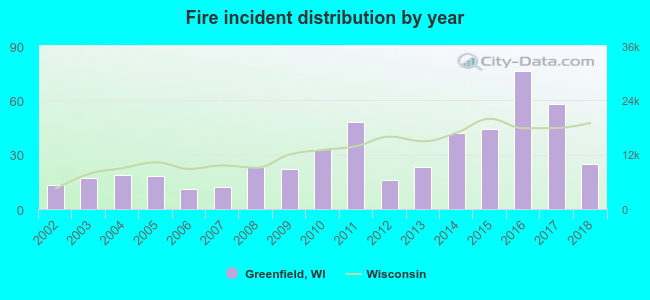 According to the data from the years 2002 - 2018 the average number of fires per year is 29. The highest number of fires - 76 took place in 2016, and the least - 11 in 2006. The data has an increasing trend.
The average number of yearly fire incidents per 10k residents in Greenfield, WI compared to nearest cities:
(Note: Based on data for the last 3 years, including only cities with population 5,000 and above)
| Greenfield: | 14.3 |
| Greendale: | 17.0 |
| Hales Corners: | 25.4 |
| West Allis: | 18.9 |
| Franklin: | 22.7 |
| New Berlin: | 28.9 |
| Milwaukee: | 33.6 |
| Wauwatosa: | 16.1 |
| Cudahy: | 31.1 |
 The median response time based on all reported fire incidents is 6 minutes. This is similar to the state median value.
The median response time in Greenfield, WI compared to nearest cities:
(Note: Based on data for all years, including only cities with at least 500 fire incidents)
| Greenfield: | 6 minutes |
| West Allis: | 4 minutes |
| Franklin: | 6 minutes |
| New Berlin: | 7 minutes |
| Milwaukee: | 4 minutes |
| Wauwatosa: | 6 minutes |
| Cudahy: | 3 minutes |
| Oak Creek: | 6 minutes |
| South Milwaukee: | 3 minutes |
 33.8% incidents where reported in the morning and 66.2% in the evening. The most fires (18.2%) took place on Saturday, and the least (11.4%) on Tuesday.
 Based on the 500 fires from years 2002 - 2018 most fires (12.8%) took place during July, and the least (5.2%) in September.
 Out of all 12,120 cases reported during the years 2002 - 2018, the most belonged to the categories: Rescue & EMS (79.4%), False Alarm (6.3%), and Fire (4.1%).
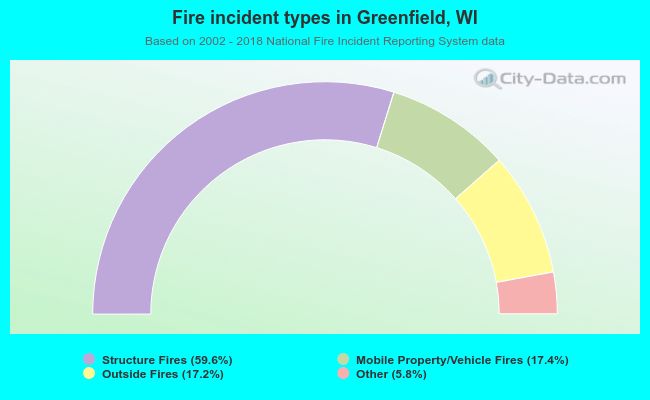 When looking into fire subcategories, the most reports belonged to: Structure Fires (59.6%), and Mobile Property/Vehicle Fires (17.4%).