Elm Grove: Fire Incidents, Wisconsin (WI)
Where are fire incidents reported in Elm Grove, WI
Something went wrong! Please refresh the page.
|
| |||||||||||||||||||||||||||||||||||||||||||||||||||||||||||||||||||||||||||||||||||||||||||||||||||||||||||||
2002 - 2018 National Fire Incident Reporting System (NFIRS) incidents
- Incident types reported to NFIRS in Elm Grove, WI
- 46747.6%Hazardous Condition
- 21421.8%False Alarm
- 14014.3%Fire
- 757.6%Good Intent Call
- 555.6%Rescue & EMS
- 252.5%Service Call
- 30.3%Overpressure Rupture
- 30.3%Severe Weather
- Fire incident types reported to NFIRS in Elm Grove, WI
- 8762.1%Structure Fires
- 2316.4%Mobile Property/Vehicle Fires
- 2014.3%Outside Fires
- 107.1%Other
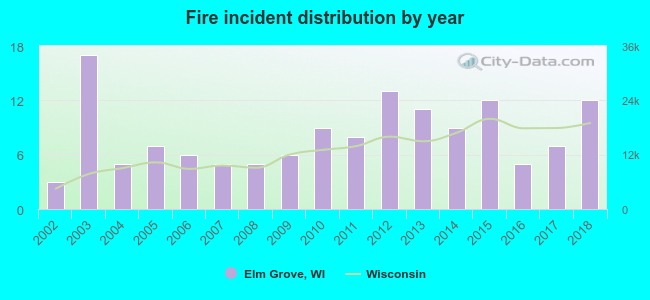 Based on the data from the years 2002 - 2018 the average number of fires per year is 8. The highest number of fires - 17 took place in 2003, and the least - 3 in 2002. The data has a growing trend.
The average number of yearly fire incidents per 10k residents in Elm Grove, WI compared to nearest cities:
(Note: Based on data for the last 3 years, including only cities with population 5,000 and above)
| Elm Grove: | 13.0 |
| Brookfield: | 23.3 |
| Wauwatosa: | 16.1 |
| West Allis: | 18.9 |
| New Berlin: | 28.9 |
| Milwaukee: | 33.6 |
| Menomonee Falls: | 22.0 |
| Greenfield: | 14.3 |
| Hales Corners: | 25.4 |

 32.1% incidents where reported in the morning and 67.9% in the evening. The most fires (20.7%) took place on Sunday, and the least (6.4%) on Thursday.
 Based on the 140 fire incident reports from years 2002 - 2018 most fires (19.3%) took place during July, and the least (0.7%) in March.
 Out of all 982 cases reported during the years 2002 - 2018, the most belonged to the categories: Hazardous Condition (47.6%), False Alarm (21.8%), and Fire (14.3%).
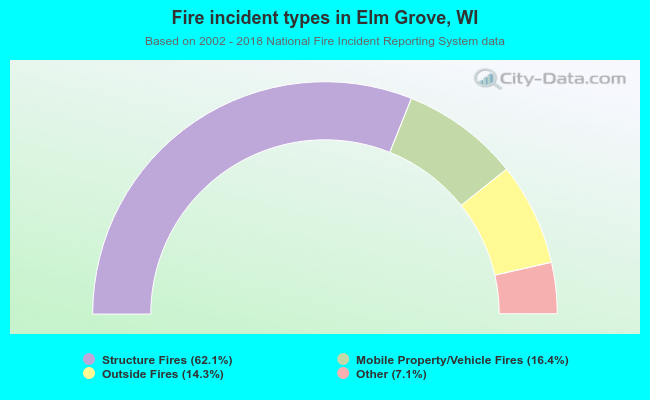 When looking into fire subcategories, the most reports belonged to: Structure Fires (62.1%), and Mobile Property/Vehicle Fires (16.4%).