Clay Center: Fire Incidents, Kansas (KS)
Where are fire incidents reported in Clay Center, KS
Something went wrong! Please refresh the page.
|
| |||||||||||||||||||||||||||||||||||||||||||||||||||||||||||||||||||||||||||||||||||||||||||||||||||||||||||||
| Other | 216 | |||||||||||||||||||||||||||||||||||||||||||||||||||||||||||||||||||||||||||||||||||||||||||||||||||||||||||||
2002 - 2018 National Fire Incident Reporting System (NFIRS) incidents
- Incident types reported to NFIRS in Clay Center, KS
- 54738.0%Hazardous Condition
- 53637.2%Fire
- 1278.8%False Alarm
- 1107.6%Rescue & EMS
- 523.6%Service Call
- 513.5%Good Intent Call
- 100.7%Overpressure Rupture
- 40.3%Special Incident
- 20.1%Severe Weather
- Fire incident types reported to NFIRS in Clay Center, KS
- 32660.8%Outside Fires
- 12022.4%Structure Fires
- 7614.2%Mobile Property/Vehicle Fires
- 142.6%Other
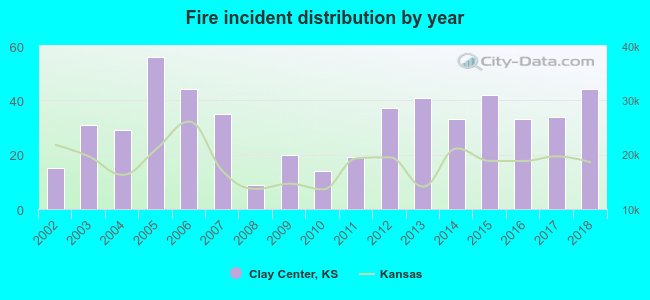 According to the data from the years 2002 - 2018 the average number of fires per year is 32. The highest number of fires - 56 took place in 2005, and the least - 9 in 2008. The data has a rising trend.
 The median response time based on all reported fire incidents is 6 minutes. This is close to the state median value.
 24.8% incidents where reported in the morning and 75.2% in the evening. The most fires (19.2%) took place on Saturday, and the least (11.6%) on Sunday.
 Based on the 536 fires from years 2002 - 2018 most fires (22.9%) took place during March, and the least (4.1%) in June.
 Out of all 1,439 cases reported during the years 2002 - 2018, the most belonged to the categories: Hazardous Condition (38.0%), Fire (37.2%), and False Alarm (8.8%).
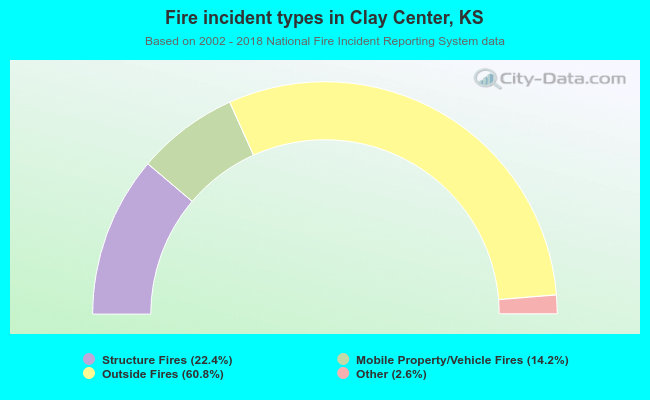 When looking into fire subcategories, the most reports belonged to: Outside Fires (60.8%), and Structure Fires (22.4%).