Junction City: Fire Incidents, Kansas (KS)
Where are fire incidents reported in Junction City, KS
Something went wrong! Please refresh the page.
| Fire incidents reported | |
|---|---|
| Sreet name | Count |
| GRANT AVE | 198 |
| WASHINGTON ST | 162 |
| I-70 HWY | 136 |
| 6TH ST | 130 |
| CHESTNUT ST | 122 |
| 8TH ST | 106 |
| I70 HWY | 100 |
| 11TH ST | 96 |
| ASH ST | 96 |
| CAROLINE AVE | 94 |
| 12TH ST | 90 |
| 14TH ST | 86 |
| CLARKS CREEK RD | 82 |
| OLD HWY 40 | 80 |
| CALHOUN ST | 72 |
| 7TH ST | 68 |
| 5TH ST | 66 |
| 4TH ST | 62 |
| HUMBOLDT CREEK RD | 62 |
| K-57 HWY | 58 |
| JEFFERSON ST | 56 |
| US-77 HWY | 56 |
| US77 HWY | 52 |
| ADAMS ST | 50 |
| 13TH ST | 48 |
| 18TH ST | 46 |
| UNION RD | 46 |
| RUCKER RD | 44 |
| DAVIS CREEK RD | 40 |
| 1ST ST | 38 |
| Other | 382 |
2002 - 2018 National Fire Incident Reporting System (NFIRS) incidents
- Incident types reported to NFIRS in Junction City, KS
- 5,41842.5%Rescue & EMS
- 2,82422.1%Fire
- 2,36818.6%Hazardous Condition
- 7876.2%False Alarm
- 6935.4%Service Call
- 6184.8%Good Intent Call
- 430.3%Overpressure Rupture
- Fire incident types reported to NFIRS in Junction City, KS
- 1,42050.3%Outside Fires
- 83129.4%Structure Fires
- 52418.6%Mobile Property/Vehicle Fires
- 491.7%Other
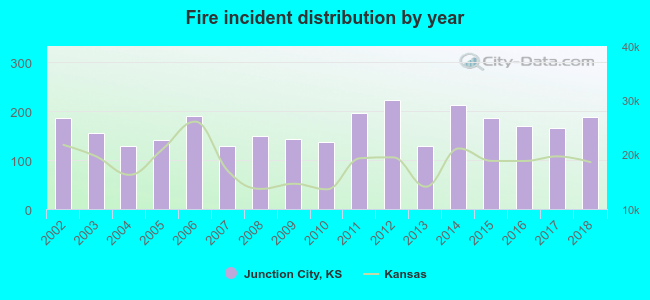 Based on the data from the years 2002 - 2018 the average number of fires per year is 166. The highest number of reported fires - 222 took place in 2012, and the least - 128 in 2004. The data has a growing trend.
The average number of yearly fire incidents per 10k residents in Junction City, KS compared to nearest cities:
(Note: Based on data for the last 3 years, including only cities with population 5,000 and above)
| Junction City: | 70.4 |
| Fort Riley: | 1.3 |
| Manhattan: | 44.4 |
| Abilene: | 77.4 |
| Salina: | 48.3 |
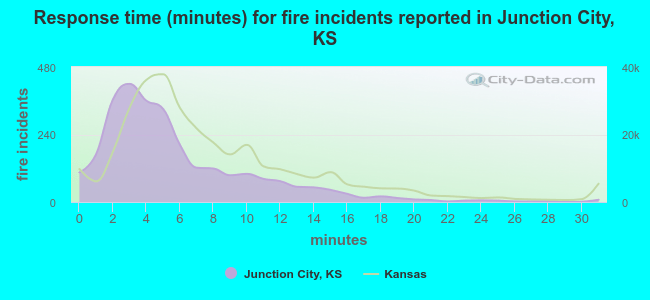 The median response time based on all reported fire incidents is 4 minutes. This is lower than the state median value.
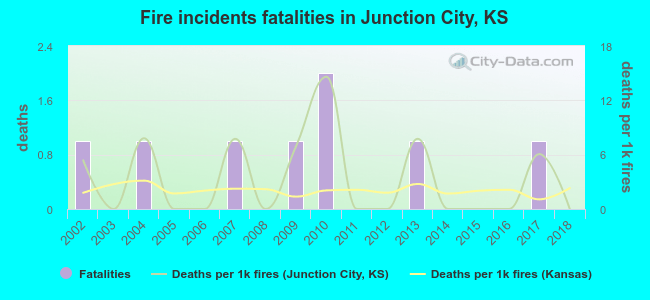 According to the reports from the years 2002 - 2018 the average number of fire-related fatalities per year is 0. The highest number of deaths - 2 took place in 2010, and the lowest - 0 in 2003. The data has a decreasing trend.
The average number of fatalities per 1,000 fires is 3. This indicator was the highest - 15 in 2010, and the lowest 0 in 2003. The trend for deaths per 1,000 fire incidents is declining. Compared to the Kansas value the number of deaths per 1,000 incidents is higher.
According to the reports from the years 2002 - 2018 the average number of fire-related fatalities per year is 0. The highest number of deaths - 2 took place in 2010, and the lowest - 0 in 2003. The data has a decreasing trend.
The average number of fatalities per 1,000 fires is 3. This indicator was the highest - 15 in 2010, and the lowest 0 in 2003. The trend for deaths per 1,000 fire incidents is declining. Compared to the Kansas value the number of deaths per 1,000 incidents is higher.
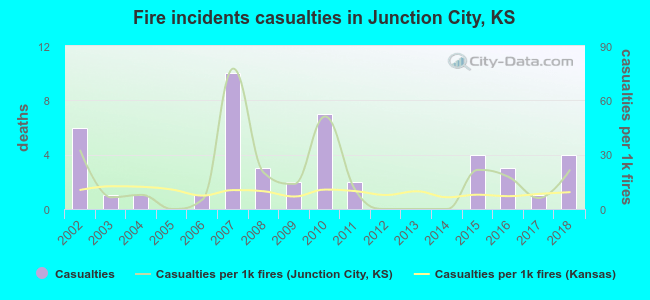 Based on the reports from the years 2002 - 2018 the average number of fire-related casualties per year is 3. The highest number of casualties - 10 took place in 2007, and the lowest - 0 in 2005. The data has a decreasing trend.
The average number of injuries per 1,000 fire incidents is 17. This indicator was the highest - 78 in 2007, and the lowest 0 in 2005. The trend for injuries per 1,000 incidents is decreasing. Compared to the Kansas value the number of injuries per 1,000 incidents is higher.
Based on the reports from the years 2002 - 2018 the average number of fire-related casualties per year is 3. The highest number of casualties - 10 took place in 2007, and the lowest - 0 in 2005. The data has a decreasing trend.
The average number of injuries per 1,000 fire incidents is 17. This indicator was the highest - 78 in 2007, and the lowest 0 in 2005. The trend for injuries per 1,000 incidents is decreasing. Compared to the Kansas value the number of injuries per 1,000 incidents is higher.
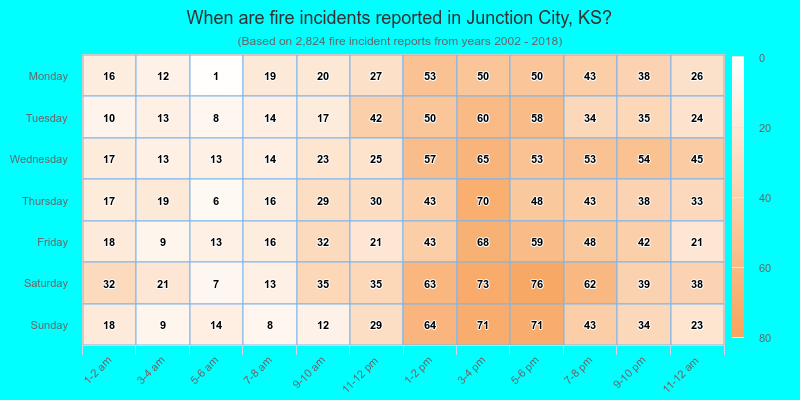
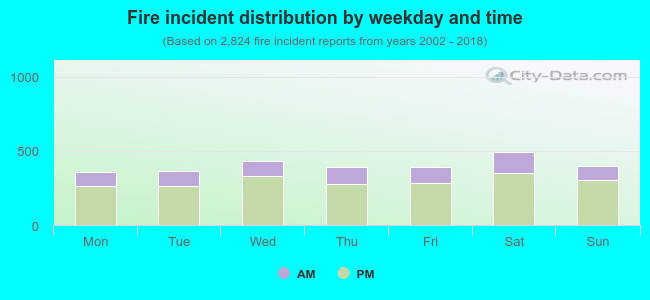 27.0% incidents where reported in the morning and 73.0% in the evening. The most fires (17.5%) took place on Saturday, and the least (12.6%) on Monday.
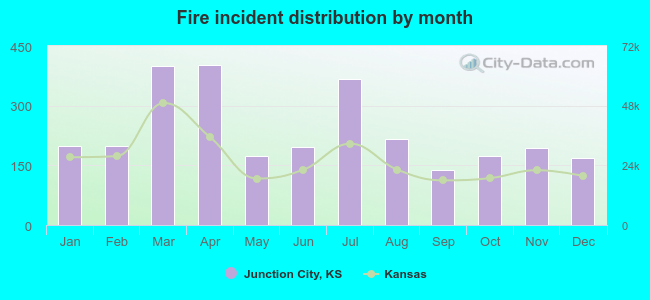 Based on the 2,824 fires from years 2002 - 2018 most fires (14.3%) took place during April, and the least (4.9%) in September.
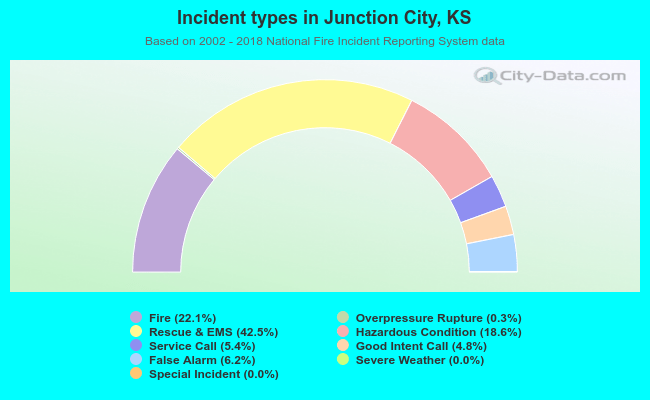 Out of all 12,760 cases reported during the years 2002 - 2018, the most belonged to the categories: Rescue & EMS (42.5%), Fire (22.1%), and Hazardous Condition (18.6%).
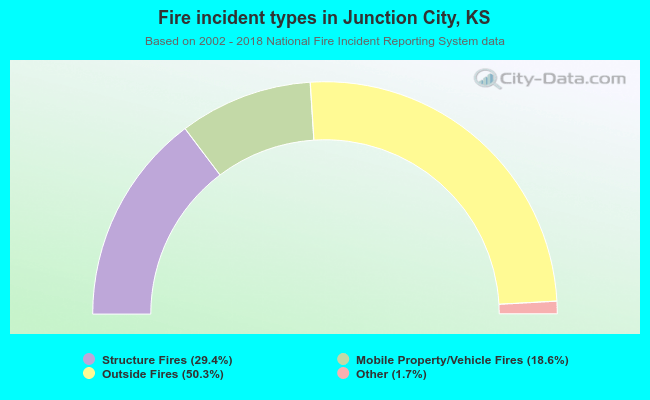 When looking into fire subcategories, the most reports belonged to: Outside Fires (50.3%), and Structure Fires (29.4%).