Concordia: Fire Incidents, Kansas (KS)
Where are fire incidents reported in Concordia, KS
Something went wrong! Please refresh the page.
|
| |||||||||||||||||||||||||||||||||||||||||||||||||||||||||||||||||||||||||||||||||||||||||||||||||||||||||||||
| Other | 117 | |||||||||||||||||||||||||||||||||||||||||||||||||||||||||||||||||||||||||||||||||||||||||||||||||||||||||||||
2002 - 2018 National Fire Incident Reporting System (NFIRS) incidents
- Incident types reported to NFIRS in Concordia, KS
- 1,10651.8%Rescue & EMS
- 68732.1%Fire
- 1999.3%Hazardous Condition
- 773.6%False Alarm
- 331.5%Good Intent Call
- 180.8%Service Call
- 80.4%Overpressure Rupture
- 60.3%Special Incident
- 30.1%Severe Weather
- Fire incident types reported to NFIRS in Concordia, KS
- 38155.5%Outside Fires
- 14721.4%Structure Fires
- 10515.3%Mobile Property/Vehicle Fires
- 547.9%Other
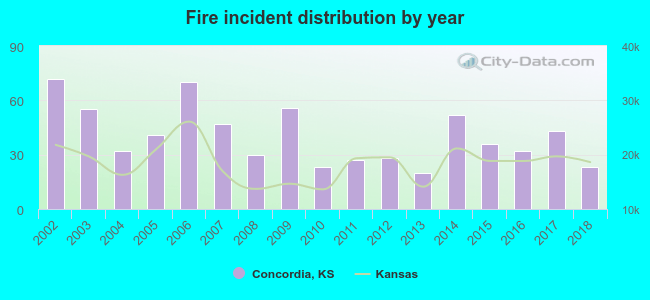 According to the data from the years 2002 - 2018 the average number of fires per year is 40. The highest number of fire incidents - 72 took place in 2002, and the least - 20 in 2013. The data has a declining trend.
The average number of yearly fire incidents per 10k residents in Concordia, KS compared to nearest cities:
(Note: Based on data for the last 3 years, including only cities with population 5,000 and above)
| Concordia: | 61.5 |
 The median response time based on all reported fire incidents is 7 minutes. This is about the same as the Kansas median value.
The median response time in Concordia, KS compared to nearest cities:
(Note: Based on data for all years, including only cities with at least 500 fire incidents)
| Concordia: | 7 minutes |
| Clay Center: | 6 minutes |
 28.1% incidents where reported in the morning and 71.9% in the evening. The most fires (17.5%) took place on Saturday, and the least (11.4%) on Sunday.
 According to the 687 fire incidents from years 2002 - 2018 most fires (17.5%) took place during March, and the least (4.2%) in May.
 Out of all 2,137 cases reported during the years 2002 - 2018, the most belonged to the categories: Rescue & EMS (51.8%), Fire (32.1%), and Hazardous Condition (9.3%).
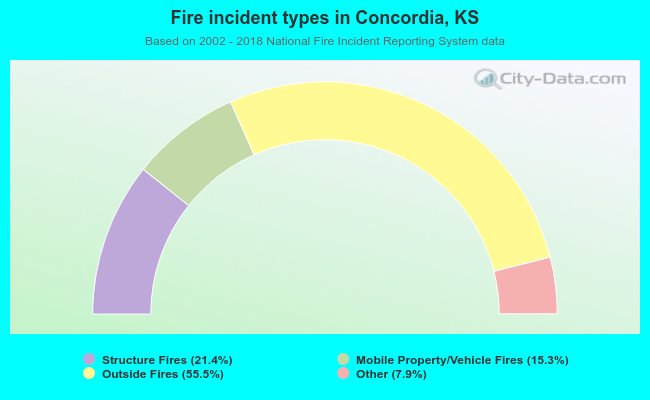 When looking into fire subcategories, the most reports belonged to: Outside Fires (55.5%), and Structure Fires (21.4%).