Avon: Fire Incidents, Connecticut (CT)
Where are fire incidents reported in Avon, CT
Something went wrong! Please refresh the page.
| Fire incidents reported | |
|---|---|
| Sreet name | Count |
| MAIN ST | 68 |
| AVONWOOD RD | 46 |
| LOVELY ST | 42 |
| HUCKLEBERRY HILL RD | 40 |
| NEW RD | 38 |
| OLD FARMS RD | 38 |
| WATERVILLE RD | 38 |
| AVON RD | 30 |
| DEERCLIFF RD | 26 |
| SIMSBURY RD | 24 |
| WEST AVON RD | 24 |
| COUNTRY CLUB RD | 22 |
| VERMILLION DR | 20 |
| WEST MAIN ST | 18 |
| AVON MOUNTAIN RD | 16 |
| MALLARD DR | 16 |
| SECRET LAKE RD | 16 |
| DARLING DR | 14 |
| LAKEVIEW BLVD | 14 |
| W MAIN ST | 14 |
| HAYNES RD | 12 |
| ARCH RD | 10 |
| BYRON DR | 10 |
| HARRIS RD | 10 |
| HERITAGE DR | 10 |
| JUNIPER DR | 10 |
| W AVON RD | 10 |
| BROOKRIDGE DR | 8 |
| COLD SPRING RD | 8 |
| FOX DEN RD | 8 |
2002 - 2018 National Fire Incident Reporting System (NFIRS) incidents
- Incident types reported to NFIRS in Avon, CT
- 2,32436.8%Hazardous Condition
- 1,13317.9%False Alarm
- 95515.1%Rescue & EMS
- 68910.9%Good Intent Call
- 65410.3%Fire
- 5027.9%Service Call
- 280.4%Severe Weather
- 200.3%Overpressure Rupture
- 140.2%Special Incident
- Fire incident types reported to NFIRS in Avon, CT
- 25438.8%Structure Fires
- 24837.9%Outside Fires
- 8613.1%Other
- 6610.1%Mobile Property/Vehicle Fires
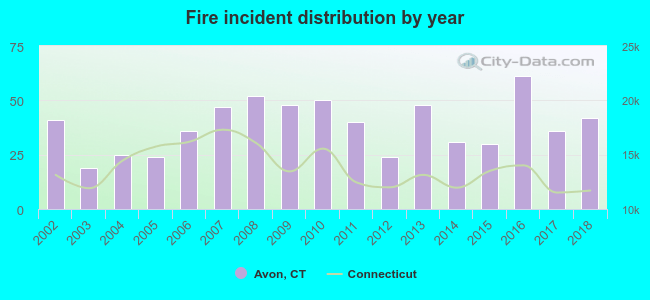 According to the data from the years 2002 - 2018 the average number of fire incidents per year is 38. The highest number of reported fire incidents - 61 took place in 2016, and the least - 19 in 2003. The data has a growing trend.
The average number of yearly fire incidents per 10k residents in Avon, CT compared to nearest cities:
(Note: Based on data for the last 3 years, including only cities with population 5,000 and above)
| Avon: | 25.6 |
| Farmington: | 22.1 |
| Canton: | 38.2 |
| Burlington: | 28.7 |
| Simsbury: | 16.0 |
| West Hartford: | 28.3 |
| Bloomfield: | 50.8 |
| Plainville: | 43.1 |
| Bristol: | 35.6 |
 The median response time based on all reported fire incidents is 7 minutes. This is higher compared to the state median value.
The median response time in Avon, CT compared to nearest cities:
(Note: Based on data for all years, including only cities with at least 500 fire incidents)
| Avon: | 7 minutes |
| Farmington: | 7 minutes |
| Simsbury: | 5 minutes |
| West Hartford: | 4 minutes |
| Bloomfield: | 6 minutes |
| Plainville: | 5 minutes |
| Bristol: | 4 minutes |
| New Britain: | 4 minutes |
| Hartford: | 4 minutes |
 Based on the data from the years 2002 - 2018 the average number of fire-related casualties per year is 0. The highest number of casualties - 1 took place in 2002, and the lowest - 0 in 2003. The data has a decreasing trend.
The average number of casualties per 1,000 fires is 9. This indicator was the highest - 40 in 2004, and the lowest 0 in 2003. The trend for injuries per 1,000 fire incidents is decreasing. Compared to the state value the number of casualties per 1,000 incidents is lower.
Based on the data from the years 2002 - 2018 the average number of fire-related casualties per year is 0. The highest number of casualties - 1 took place in 2002, and the lowest - 0 in 2003. The data has a decreasing trend.
The average number of casualties per 1,000 fires is 9. This indicator was the highest - 40 in 2004, and the lowest 0 in 2003. The trend for injuries per 1,000 fire incidents is decreasing. Compared to the state value the number of casualties per 1,000 incidents is lower.Casualties per 1,000 incidents in Avon, CT compared to nearest cities:
(Note: Based on data for all years, including only cities with at least 500 fire incidents)
| Avon: | 7.6 |
| Farmington: | 17.2 |
| Simsbury: | 6.9 |
| West Hartford: | 18.4 |
| Bloomfield: | 26.3 |
| Plainville: | 31.2 |
| Bristol: | 25.9 |
| New Britain: | 21.0 |
| Hartford: | 10.9 |
 27.2% incidents where reported in the morning and 72.8% in the evening. The most fires (15.3%) took place on Sunday, and the least (13.6%) on Thursday.
 According to the 654 incident reports from years 2002 - 2018 most fires (19.1%) took place during April, and the least (5.0%) in December.
 Out of all 6,319 cases reported during the years 2002 - 2018, the most belonged to the categories: Hazardous Condition (36.8%), False Alarm (17.9%), and Rescue & EMS (15.1%).
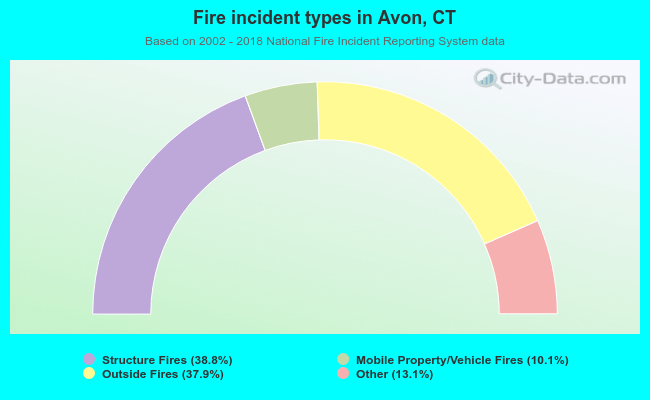 When looking into fire subcategories, the most incidents belonged to: Structure Fires (38.8%), and Outside Fires (37.9%).