Burlington: Fire Incidents, Connecticut (CT)
Where are fire incidents reported in Burlington, CT
Something went wrong! Please refresh the page.
|
| |||||||||||||||||||||||||||||||||||||||||||||||||||||||||||||||||||||||||||||||||||||||||||||||||||||||||||||
2002 - 2018 National Fire Incident Reporting System (NFIRS) incidents
- Incident types reported to NFIRS in Burlington, CT
- 2,45259.0%Rescue & EMS
- 48511.7%Hazardous Condition
- 4049.7%Fire
- 3197.7%Good Intent Call
- 2686.5%False Alarm
- 2105.1%Service Call
- 120.3%Severe Weather
- Fire incident types reported to NFIRS in Burlington, CT
- 19347.8%Structure Fires
- 13332.9%Outside Fires
- 5112.6%Mobile Property/Vehicle Fires
- 276.7%Other
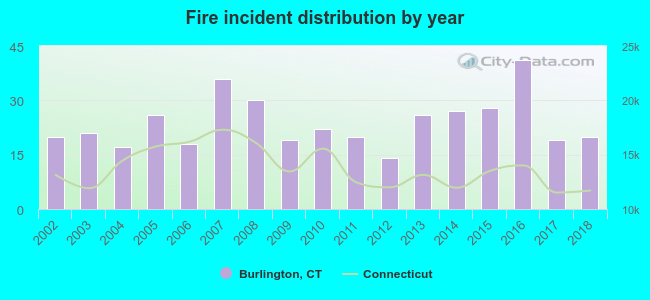 Based on the data from the years 2002 - 2018 the average number of fires per year is 24. The highest number of fires - 41 took place in 2016, and the least - 14 in 2012. The data has a constant trend.
The average number of yearly fire incidents per 10k residents in Burlington, CT compared to nearest cities:
(Note: Based on data for the last 3 years, including only cities with population 5,000 and above)
| Burlington: | 28.7 |
| Avon: | 25.6 |
| Farmington: | 22.1 |
| Bristol: | 35.6 |
| Canton: | 38.2 |
| Terryville: | 26.0 |
| Harwinton: | 42.5 |
| Plymouth: | 3.7 |
| New Hartford: | 41.6 |

 According to the reports from the years 2002 - 2018 the average number of fire-related casualties per year is 0. The highest number of reported injuries - 2 took place in 2013, and the lowest - 0 in 2002. The data has an increasing trend.
 28.5% incidents where reported in the morning and 71.5% in the evening. The most fires (17.3%) took place on Saturday, and the least (11.4%) on Friday.
 Based on the 404 fire incident reports from years 2002 - 2018 most fires (14.9%) took place during April, and the least (5.4%) in August.
 Out of all 4,155 cases reported during the years 2002 - 2018, the most belonged to the categories: Rescue & EMS (59.0%), Hazardous Condition (11.7%), and Fire (9.7%).
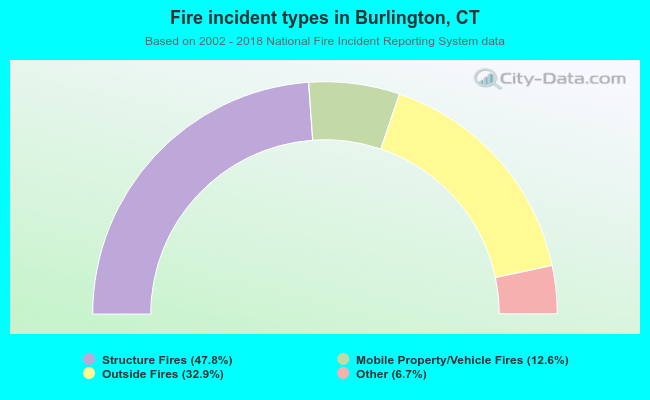 When looking into fire subcategories, the most incidents belonged to: Structure Fires (47.8%), and Outside Fires (32.9%).