Hartford: Fire Incidents, Connecticut (CT)
Where are fire incidents reported in Hartford, CT
Something went wrong! Please refresh the page.
| Fire incidents reported | |
|---|---|
| Sreet name | Count |
| MAIN ST | 816 |
| PARK ST | 376 |
| BROAD ST | 352 |
| WETHERSFIELD AV | 336 |
| ALBANY AV | 330 |
| FLATBUSH AV | 314 |
| GARDEN ST | 310 |
| WASHINGTON ST | 286 |
| FRANKLIN AV | 252 |
| WOODLAND ST | 248 |
| VINE ST | 242 |
| BLOOMFIELD AV | 214 |
| FARMINGTON AV | 204 |
| FLATBUSH | 202 |
| BARBOUR ST | 188 |
| MAPLE AV | 186 |
| SIGOURNEY ST | 186 |
| CAPITOL AV | 170 |
| EDGEWOOD ST | 166 |
| ZION ST | 164 |
| BLUE HILLS AV | 156 |
| LAUREL ST | 156 |
| EVERGREEN AV | 154 |
| NEW BRITAIN AV | 152 |
| ASYLUM AV | 148 |
| COLLINS ST | 148 |
| MARTIN ST | 128 |
| HILLSIDE AV | 124 |
| MARSHALL ST | 124 |
| SISSON AV | 122 |
| Other | 3,179 |
2002 - 2018 National Fire Incident Reporting System (NFIRS) incidents
- Incident types reported to NFIRS in Hartford, CT
- 66,93460.8%Rescue & EMS
- 10,1339.2%Fire
- 10,0379.1%Service Call
- 9,3048.4%Hazardous Condition
- 6,8936.3%False Alarm
- 6,3385.8%Good Intent Call
- 4210.4%Special Incident
- Fire incident types reported to NFIRS in Hartford, CT
- 4,40243.4%Structure Fires
- 3,08130.4%Outside Fires
- 2,05720.3%Mobile Property/Vehicle Fires
- 5935.9%Other
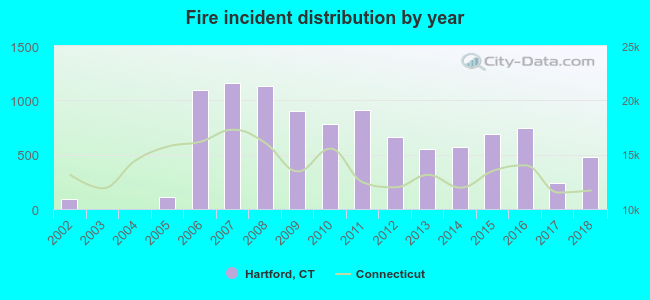 Based on the data from the years 2002 - 2018 the average number of fires per year is 596. The highest number of fires - 1,163 took place in 2007, and the least - 2 in 2004. The data has a rising trend.
The average number of yearly fire incidents per 10k residents in Hartford, CT compared to nearest cities:
(Note: Based on data for the last 3 years, including only cities with population 5,000 and above)
| Hartford: | 39.1 |
| West Hartford: | 28.3 |
| East Hartford: | 37.3 |
| Wethersfield: | 22.0 |
| Bloomfield: | 50.8 |
| Newington: | 31.2 |
| Windsor: | 48.0 |
| Rocky Hill: | 51.8 |
| Glastonbury: | 19.0 |
 The median response time based on all reported fire incidents is 4 minutes. This is lower compared to the Connecticut median value.
The median response time in Hartford, CT compared to nearest cities:
(Note: Based on data for all years, including only cities with at least 500 fire incidents)
| Hartford: | 4 minutes |
| West Hartford: | 4 minutes |
| East Hartford: | 4 minutes |
| Wethersfield: | 7 minutes |
| Bloomfield: | 6 minutes |
| Newington: | 6 minutes |
| Windsor: | 6 minutes |
| Rocky Hill: | 7 minutes |
| Glastonbury: | 6 minutes |
 Based on the reports from the years 2002 - 2018 the average number of fire-related fatalities per year is 2. The highest number of reported deaths - 16 took place in 2003, and the lowest - 0 in 2004. The data has a declining trend.
The average number of deaths per 1,000 fire incidents is 315. This indicator was the highest - 5,333 in 2003, and the lowest 0 in 2004. The trend for deaths per 1,000 fires is decreasing. Compared to the state value the number of deaths per 1,000 fires is much higher.
Based on the reports from the years 2002 - 2018 the average number of fire-related fatalities per year is 2. The highest number of reported deaths - 16 took place in 2003, and the lowest - 0 in 2004. The data has a declining trend.
The average number of deaths per 1,000 fire incidents is 315. This indicator was the highest - 5,333 in 2003, and the lowest 0 in 2004. The trend for deaths per 1,000 fires is decreasing. Compared to the state value the number of deaths per 1,000 fires is much higher.Deaths per 1,000 incidents in Hartford, CT compared to nearest cities:
(Note: Based on data for all years, including only cities with at least 2,500 fire incidents)
| Hartford: | 3.0 |
| West Hartford: | 1.6 |
| East Hartford: | 1.1 |
| New Britain: | 1.2 |
| Manchester: | 1.7 |
| Bristol: | 1.5 |
| Middletown: | 0.9 |
| Enfield: | 2.5 |
| Meriden: | 1.6 |
 According to the data from the years 2002 - 2018 the average number of fire-related yearly casualties is 6. The highest number of casualties - 17 took place in 2003, and the lowest - 0 in 2004. The data has a growing trend.
The average number of injuries per 1,000 fire incidents is 344. This indicator was the highest - 5,667 in 2003, and the lowest 0 in 2004. The trend for injuries per 1,000 fire incidents is declining. Compared to the Connecticut value the number of injuries per 1,000 fires is similar.
According to the data from the years 2002 - 2018 the average number of fire-related yearly casualties is 6. The highest number of casualties - 17 took place in 2003, and the lowest - 0 in 2004. The data has a growing trend.
The average number of injuries per 1,000 fire incidents is 344. This indicator was the highest - 5,667 in 2003, and the lowest 0 in 2004. The trend for injuries per 1,000 fire incidents is declining. Compared to the Connecticut value the number of injuries per 1,000 fires is similar.Casualties per 1,000 incidents in Hartford, CT compared to nearest cities:
(Note: Based on data for all years, including only cities with at least 500 fire incidents)
| Hartford: | 10.9 |
| West Hartford: | 18.4 |
| East Hartford: | 34.6 |
| Wethersfield: | 21.5 |
| Bloomfield: | 26.3 |
| Newington: | 2.6 |
| Windsor: | 1.1 |
| Rocky Hill: | 7.2 |
| Glastonbury: | 16.7 |
 35.2% incidents where reported in the morning and 64.8% in the evening. The most fires (15.4%) took place on Saturday, and the least (13.3%) on Thursday.
 Based on the 10,133 fires from years 2002 - 2018 most fires (12.0%) took place during May, and the least (6.2%) in December.
 Out of all 110,107 cases reported during the years 2002 - 2018, the most belonged to the categories: Rescue & EMS (60.8%), Fire (9.2%), and Service Call (9.1%).
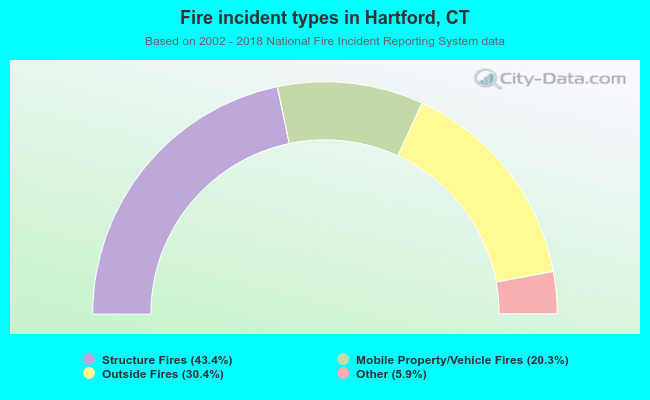 When looking into fire subcategories, the most reports belonged to: Structure Fires (43.4%), and Outside Fires (30.4%).