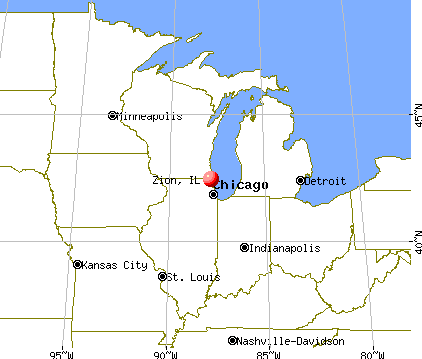
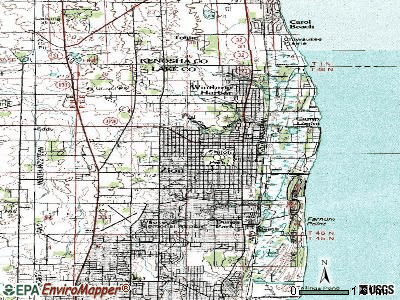
Zion, Illinois
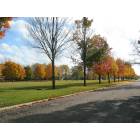
Zion: Bethesda Blvd and 20th Street
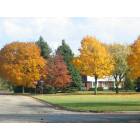
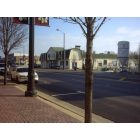
Zion: One of several Blvd's that show the best of the city
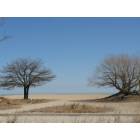
Zion: Two Tree at Zion St. Beach

Zion: Homes on Ezra and 20th Street
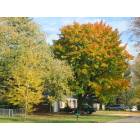
Zion: Homes on Garnett and 20th Street
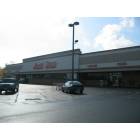
Zion: Jewel and Osco on Sheridan and Route 173
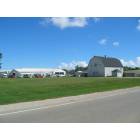
Zion: Circle Concrete, one of many businesses that has been around for years
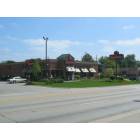
Zion: Applebee's on Sheridan and Route 173

Zion: local landfill
Zion: Shiloh Village 2711 Sheridan Rd. Zion, Illinois @2011
Zion: Lake Michigan.
- see
26
more - add
your
Submit your own pictures of this city and show them to the world
- OSM Map
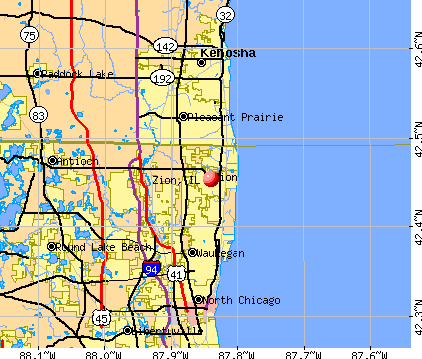
- General Map
- Google Map
- MSN Map
Population change since 2000: +6.3%
 |
| Males: 12,063 | |
| Females: 12,252 |
| Median resident age: | 32.8 years |
| Illinois median age: | 39.1 years |
Zip codes: 60099.
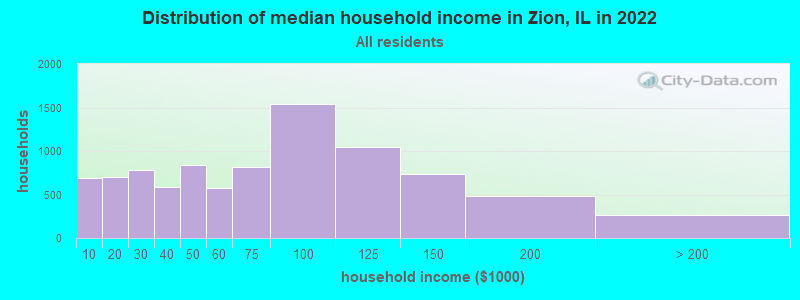
| Zion: | $63,083 |
| IL: | $76,708 |
Estimated per capita income in 2022: $30,796 (it was $17,730 in 2000)
Zion city income, earnings, and wages data
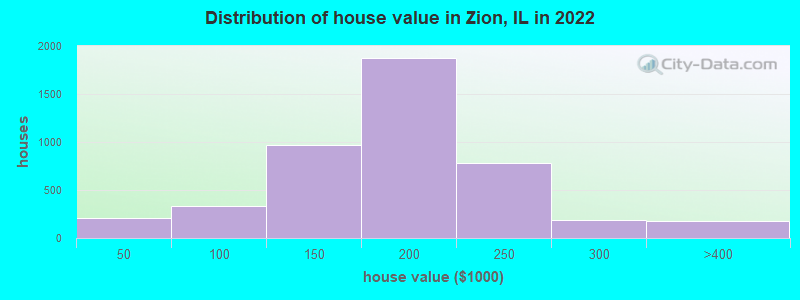
Estimated median house or condo value in 2022: $170,849 (it was $115,100 in 2000)
| Zion: | $170,849 |
| IL: | $251,600 |
Mean prices in 2022: all housing units: $170,440; detached houses: $168,336; townhouses or other attached units: $275,988; in 2-unit structures: $109,231; in 3-to-4-unit structures: $330,613; in 5-or-more-unit structures: $228,147
Median gross rent in 2022: $1,080.
(9.4% for White Non-Hispanic residents, 24.8% for Black residents, 9.1% for Hispanic or Latino residents, 10.9% for other race residents, 16.8% for two or more races residents)
Detailed information about poverty and poor residents in Zion, IL


Compare current foreclosures in Zion, IL:
| Photo | Address | Area | Beds / Baths | Price | Details |
|---|---|---|---|---|---|

|
#1
Enoch Ave
Zion, IL 60099
|
1,462 sq. feet
|
2 baths 3 beds |
show details | |

|
#2
Luke Ave
Zion, IL 60099
|
1,524 sq. feet
|
2 baths 3 beds |
show details | |

|
#3
Elisha Ave
Zion, IL 60099
|
1,404 sq. feet
|
2 baths 4 beds |
show details | |

|
#4
Cardinal Dr
Zion, IL 60099
|
1,056 sq. feet
|
2 baths - beds |
show details | |

|
#5
Gideon Ave
Zion, IL 60099
|
1,040 sq. feet
|
1 baths - beds |
show details | |

|
#6
Gabriel Ave
Zion, IL 60099
|
1,144 sq. feet
|
2 baths - beds |
show details | |

|
#7
Sarah Dr
Zion, IL 60099
|
1,710 sq. feet
|
2 baths - beds |
show details | |

|
#8
Galilee Ave
Zion, IL 60099
|
1,359 sq. feet
|
2 baths - beds |
show details | |

|
#9
Harbor Ridge Dr
Zion, IL 60099
|
1,716 sq. feet
|
2 baths - beds |
show details | |

|
#10
Midday Dr
Zion, IL 60099
|
2,068 sq. feet
|
2 baths - beds |
show details |
| Photo | Address | Area | Beds / Baths | Price | Details |
|---|---|---|---|---|---|

|
#11
Barnhart Ct
Zion, IL 60099
|
1,614 sq. feet
|
2 baths - beds |
show details | |

|
#12
Hebron Ave
Zion, IL 60099
|
975 sq. feet
|
1 baths - beds |
show details | |

|
#13
Gilead Ave
Zion, IL 60099
|
1,064 sq. feet
|
1 baths - beds |
show details | |

|
#14
Gilead Ave
Zion, IL 60099
|
924 sq. feet
|
1 baths - beds |
show details | |

|
#15
Elizabeth Ave
Zion, IL 60099
|
1,368 sq. feet
|
1 baths - beds |
show details | |

|
#16
Bethel Blvd
Zion, IL 60099
|
1,981 sq. feet
|
2 baths - beds |
show details | |

|
#17
Salem Blvd
Zion, IL 60099
|
1,702 sq. feet
|
1 baths - beds |
show details | |

|
#18
Elisha Ave
Zion, IL 60099
|
1,604 sq. feet
|
3 baths - beds |
show details | |

|
#19
Ezekiel Ave
Zion, IL 60099
|
816 sq. feet
|
1 baths - beds |
show details | |

|
#20
W Chaplin Ave
Zion, IL 60099
|
1,264 sq. feet
|
2 baths - beds |
show details |
| Photo | Address | Area | Beds / Baths | Price | Details |
|---|---|---|---|---|---|

|
#21
Elim Ave
Zion, IL 60099
|
1,102 sq. feet
|
2 baths - beds |
show details | |

|
#22
N Cornell St
Zion, IL 60099
|
1,324 sq. feet
|
3 baths - beds |
show details | |

|
#23
Gideon Ave
Zion, IL 60099
|
1,358 sq. feet
|
1 baths - beds |
show details | |

|
#24
Pheasant Run
Zion, IL 60099
|
1,440 sq. feet
|
1 baths - beds |
show details | |

|
#25
Pheasant Run
Zion, IL 60099
|
1,508 sq. feet
|
1 baths - beds |
show details | |

|
#26
Elizabeth Ave
Zion, IL 60099
|
1,402 sq. feet
|
1 baths - beds |
show details | |

|
#27
W Illinois Ave
Zion, IL 60099
|
1,656 sq. feet
|
1 baths - beds |
show details | |

|
#28
20th St
Zion, IL 60099
|
925 sq. feet
|
1 baths - beds |
show details | |

|
#29
Willow Crest Dr
Zion, IL 60099
|
2,102 sq. feet
|
2 baths - beds |
show details | |

|
#30
Gideon Ave
Zion, IL 60099
|
1,247 sq. feet
|
2 baths - beds |
show details |
| Photo | Address | Area | Beds / Baths | Price | Details |
|---|---|---|---|---|---|

|
#31
Winthrop Ct
Zion, IL 60099
|
1,120 sq. feet
|
1 baths - beds |
show details | |

|
#32
Ezekiel Ave
Zion, IL 60099
|
1,056 sq. feet
|
2 baths - beds |
show details | |

|
#33
Gilboa Ave
Zion, IL 60099
|
1,448 sq. feet
|
1 baths - beds |
show details | |

|
#34
Gideon Ave
Zion, IL 60099
|
1,116 sq. feet
|
1 baths - beds |
show details | |

|
#35
W 18th St
Zion, IL 60099
|
1,512 sq. feet
|
2 baths - beds |
show details | |

|
#36
N North Ave
Zion, IL 60099
|
1,464 sq. feet
|
2 baths - beds |
show details | |

|
#37
Phillip Dr
Zion, IL 60099
|
3,400 sq. feet
|
3 baths - beds |
show details | |

|
#38
18th St
Zion, IL 60099
|
1,084 sq. feet
|
2 baths - beds |
show details | |

|
#39
19th St
Zion, IL 60099
|
2,016 sq. feet
|
1 baths - beds |
show details | |

|
#40
Cypress Dr
Zion, IL 60099
|
2,416 sq. feet
|
2 baths - beds |
show details |
| Photo | Address | Area | Beds / Baths | Price | Details |
|---|---|---|---|---|---|

|
#41
33rd St
Zion, IL 60099
|
720 sq. feet
|
1 baths - beds |
show details | |

|
#42
Brigadoon Dr
Zion, IL 60099
|
794 sq. feet
|
2 baths - beds |
show details | |

|
#43
Gideon Ave
Zion, IL 60099
|
1,247 sq. feet
|
1 baths - beds |
show details | |

|
#44
Daybreak Ln
Zion, IL 60099
|
2,750 sq. feet
|
4 baths - beds |
show details | |

|
#45
Winthrop Ct
Zion, IL 60099
|
1,060 sq. feet
|
2 baths - beds |
show details | |

|
#46
Gideon Ave
Zion, IL 60099
|
743 sq. feet
|
1 baths - beds |
show details | |

|
#47
Dusk Dr
Zion, IL 60099
|
2,169 sq. feet
|
2 baths - beds |
show details | |

|
#48
Salem Blvd Apt 2
Zion, IL 60099
|
- sq. feet
|
- baths - beds |
show details | |

|
#49
29th St Apt 402
Zion, IL 60099
|
- sq. feet
|
- baths - beds |
show details | |

|
Check over 1 million property listings on Foreclosure.com!
|
browse all offers | |||


- 10,25542.0%Hispanic
- 6,74127.6%White alone
- 4,97620.4%Black alone
- 1,5736.4%Two or more races
- 8803.6%Asian alone
- 3061.3%Other race alone
- 310.1%American Indian alone
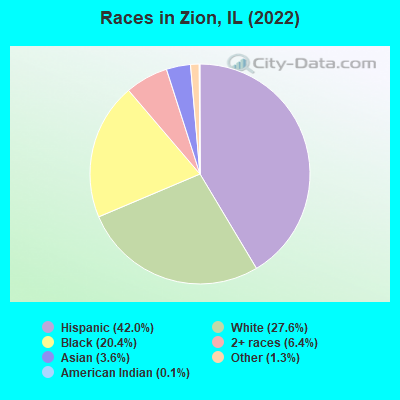
Races in Zion detailed stats: ancestries, foreign born residents, place of birth
According to our research of Illinois and other state lists, there were 102 registered sex offenders living in Zion, Illinois as of May 23, 2024.
The ratio of all residents to sex offenders in Zion is 237 to 1.
Type |
2011 |
2012 |
2013 |
2014 |
2015 |
2016 |
2017 |
2018 |
2019 |
2020 |
2022 |
|---|---|---|---|---|---|---|---|---|---|---|---|
| Murders (per 100,000) | 0 (0.0) | 1 (4.1) | 5 (20.5) | 1 (4.1) | 3 (12.4) | 2 (8.3) | 1 (4.2) | 4 (16.7) | 2 (8.5) | 3 (12.8) | 5 (20.5) |
| Rapes (per 100,000) | 24 (98.0) | 33 (134.6) | 19 (78.1) | 20 (82.3) | 28 (115.5) | 37 (153.7) | 73 (304.6) | 33 (138.2) | 32 (135.5) | 26 (111.2) | 23 (94.5) |
| Robberies (per 100,000) | 30 (122.5) | 24 (97.9) | 34 (139.7) | 38 (156.3) | 32 (132.0) | 31 (128.8) | 26 (108.5) | 45 (188.4) | 25 (105.9) | 32 (136.8) | 10 (41.1) |
| Assaults (per 100,000) | 95 (388.0) | 87 (354.8) | 88 (361.6) | 111 (456.5) | 86 (354.8) | 99 (411.4) | 70 (292.0) | 62 (259.6) | 71 (300.6) | 84 (359.2) | 85 (349.1) |
| Burglaries (per 100,000) | 383 (1,564) | 418 (1,705) | 243 (998.4) | 275 (1,131) | 180 (742.6) | 127 (527.7) | 120 (500.6) | 129 (540.1) | 96 (406.5) | 57 (243.7) | 60 (246.4) |
| Thefts (per 100,000) | 422 (1,723) | 585 (2,386) | 520 (2,137) | 491 (2,019) | 494 (2,038) | 449 (1,866) | 455 (1,898) | 549 (2,299) | 461 (1,952) | 388 (1,659) | 311 (1,277) |
| Auto thefts (per 100,000) | 29 (118.4) | 34 (138.7) | 37 (152.0) | 51 (209.7) | 58 (239.3) | 31 (128.8) | 41 (171.1) | 38 (159.1) | 83 (351.4) | 97 (414.8) | 105 (431.2) |
| Arson (per 100,000) | 4 (16.3) | 5 (20.4) | 5 (20.5) | 2 (8.2) | 7 (28.9) | 10 (41.6) | 4 (16.7) | 4 (16.7) | 8 (33.9) | 10 (42.8) | 2 (8.2) |
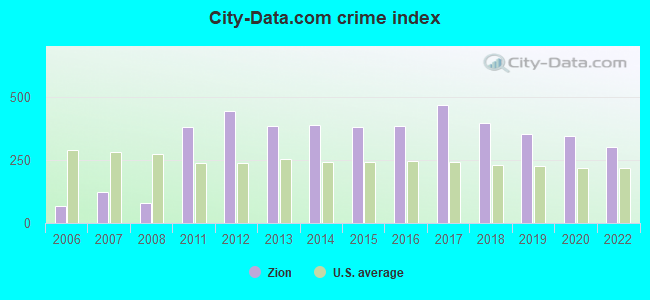
| City-Data.com crime index | 380.7 | 442.0 | 385.3 | 388.9 | 380.4 | 382.4 | 467.6 | 394.9 | 351.9 | 344.1 | 301.6 |
The City-Data.com crime index weighs serious crimes and violent crimes more heavily. Higher means more crime, U.S. average is 246.1. It adjusts for the number of visitors and daily workers commuting into cities.
Crime rate in Zion detailed stats: murders, rapes, robberies, assaults, burglaries, thefts, arson
Full-time law enforcement employees in 2019, including police officers: 48 (44 officers - 40 male; 4 female).
| Officers per 1,000 residents here: | 1.86 |
| Illinois average: | 3.06 |
 Recent articles from our blog. Our writers, many of them Ph.D. graduates or candidates, create easy-to-read articles on a wide variety of topics.

 | Is Waukegan a realistic choice? (21 replies) |
| Looking to relocate from Chicago to Northern Burbia. (Winthrop Harbor, Zion, Waukegan areas) (15 replies) |
| Lake County Tiers (17 replies) |
| Looking for N/NW suburbs with (at least some) racial diversity (29 replies) |
| Moving to Zion, IL soon (6 replies) |
| Chicago's Best Suburban Schools 2016: Chicago Magazine (55 replies) |
Latest news from Zion, IL collected exclusively by city-data.com from local newspapers, TV, and radio stations
Ancestries: German (4.0%), Irish (2.3%), English (2.2%), American (1.8%).
Current Local Time: CST time zone
Incorporated on 04/02/1902
Elevation: 660 feet
Land area: 8.20 square miles.
Population density: 2,966 people per square mile (average).
4,073 residents are foreign born (12.0% Latin America, 3.3% Asia).
| This city: | 16.7% |
| Illinois: | 14.1% |
Median real estate property taxes paid for housing units with mortgages in 2022: $5,898 (3.5%)
Median real estate property taxes paid for housing units with no mortgage in 2022: $5,360 (3.1%)
Nearest city with pop. 50,000+: Waukegan, IL  (5.7 miles , pop. 87,901).
Nearest city with pop. 200,000+: Milwaukee, WI (41.8 miles , pop. 596,974).
Nearest city with pop. 1,000,000+: Chicago, IL (43.2 miles , pop. 2,896,016).
Nearest cities:
)Latitude: 42.45 N, Longitude: 87.84 W
Daytime population change due to commuting: -6,498 (-26.6%)
Workers who live and work in this city: 2,341 (19.4%)
Area codes: 847, 224
Property values in Zion, IL

Zion, Illinois accommodation & food services, waste management - Economy and Business Data
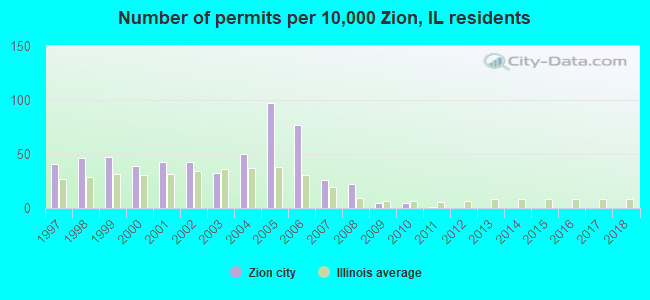
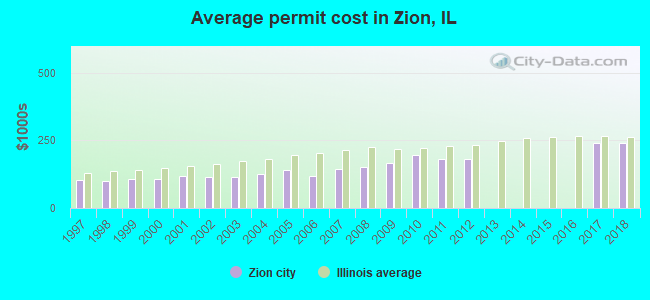
Single-family new house construction building permits:
- 2018: 1 building, cost: $240,000
- 2017: 1 building, cost: $240,000
- 2012: 1 building, cost: $182,000
- 2011: 2 buildings, average cost: $182,000
- 2010: 10 buildings, average cost: $193,700
- 2009: 11 buildings, average cost: $165,800
- 2008: 51 buildings, average cost: $149,900
- 2007: 60 buildings, average cost: $144,800
- 2006: 175 buildings, average cost: $118,700
- 2005: 222 buildings, average cost: $142,100
- 2004: 114 buildings, average cost: $125,500
- 2003: 74 buildings, average cost: $115,000
- 2002: 97 buildings, average cost: $115,800
- 2001: 98 buildings, average cost: $117,800
- 2000: 89 buildings, average cost: $108,200
- 1999: 108 buildings, average cost: $107,400
- 1998: 105 buildings, average cost: $99,800
- 1997: 93 buildings, average cost: $104,300
| Here: | 8.0% |
| Illinois: | 4.2% |
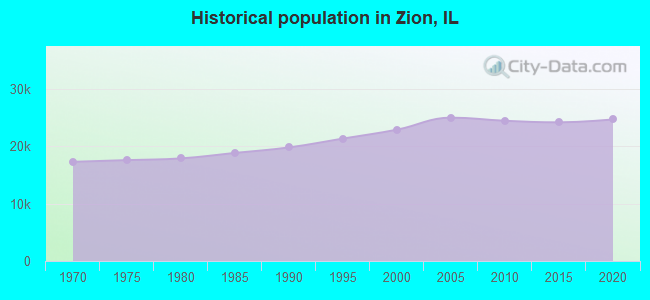
Population change in the 1990s: +2,882 (+14.4%).
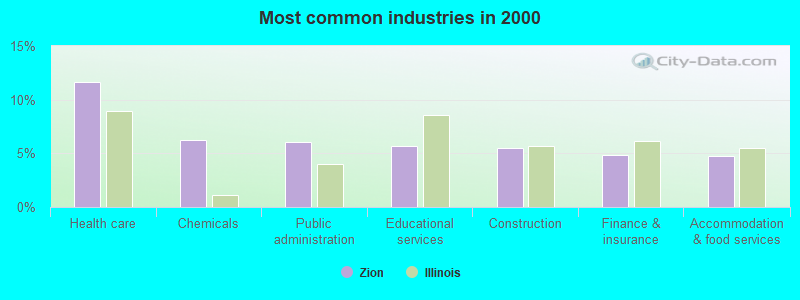
- Health care (11.7%)
- Chemicals (6.2%)
- Public administration (6.0%)
- Educational services (5.7%)
- Construction (5.5%)
- Finance & insurance (4.8%)
- Accommodation & food services (4.8%)
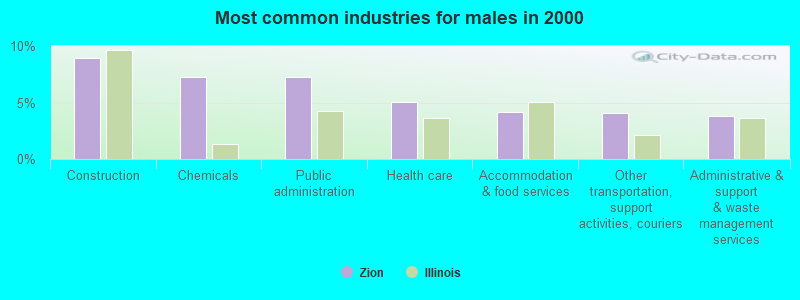
- Construction (8.9%)
- Chemicals (7.3%)
- Public administration (7.2%)
- Health care (5.1%)
- Accommodation & food services (4.1%)
- Other transportation, support activities, couriers (4.1%)
- Administrative & support & waste management services (3.8%)
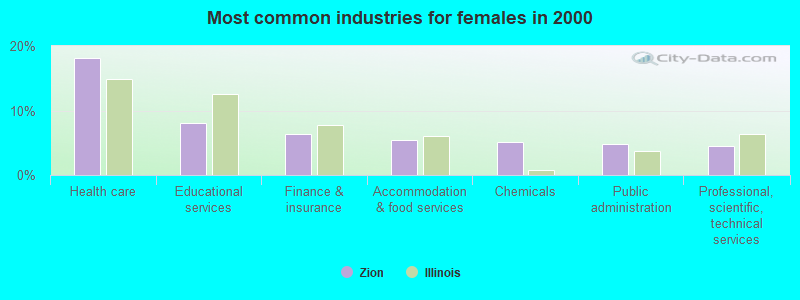
- Health care (18.1%)
- Educational services (8.0%)
- Finance & insurance (6.4%)
- Accommodation & food services (5.5%)
- Chemicals (5.2%)
- Public administration (4.9%)
- Professional, scientific, technical services (4.5%)
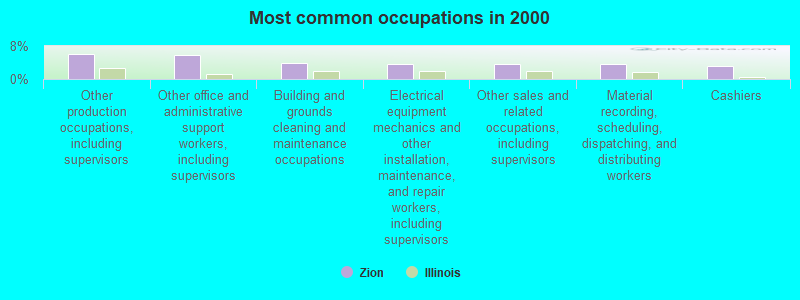
- Other production occupations, including supervisors (6.1%)
- Other office and administrative support workers, including supervisors (5.7%)
- Building and grounds cleaning and maintenance occupations (4.0%)
- Electrical equipment mechanics and other installation, maintenance, and repair workers, including supervisors (3.7%)
- Other sales and related occupations, including supervisors (3.6%)
- Material recording, scheduling, dispatching, and distributing workers (3.6%)
- Cashiers (3.0%)
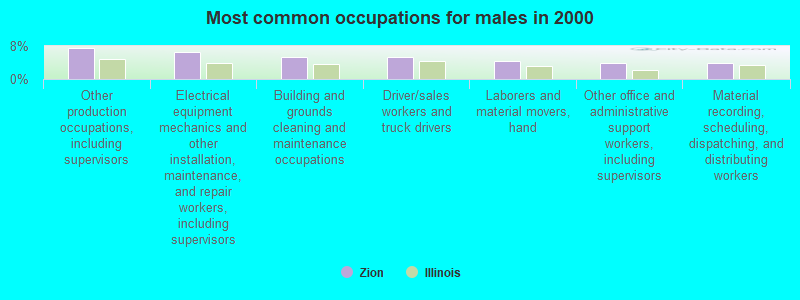
- Other production occupations, including supervisors (7.6%)
- Electrical equipment mechanics and other installation, maintenance, and repair workers, including supervisors (6.6%)
- Building and grounds cleaning and maintenance occupations (5.4%)
- Driver/sales workers and truck drivers (5.2%)
- Laborers and material movers, hand (4.3%)
- Other office and administrative support workers, including supervisors (3.9%)
- Material recording, scheduling, dispatching, and distributing workers (3.8%)
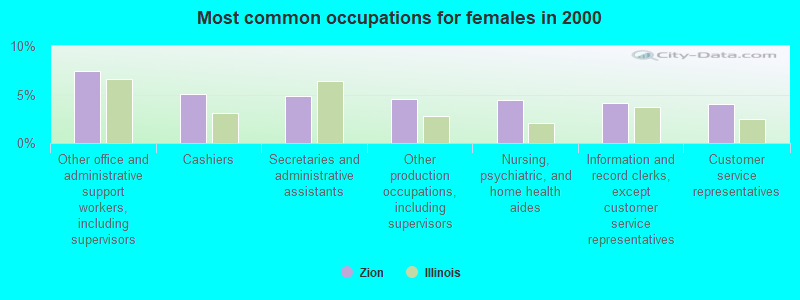
- Other office and administrative support workers, including supervisors (7.4%)
- Cashiers (5.1%)
- Secretaries and administrative assistants (4.8%)
- Other production occupations, including supervisors (4.6%)
- Nursing, psychiatric, and home health aides (4.5%)
- Information and record clerks, except customer service representatives (4.1%)
- Customer service representatives (4.0%)
Average climate in Zion, Illinois
Based on data reported by over 4,000 weather stations


|
|

(lower is better)
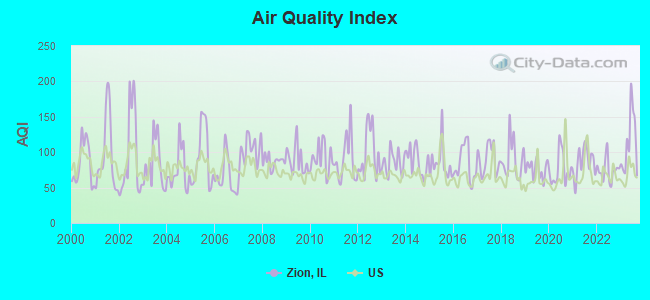
Air Quality Index (AQI) level in 2023 was 113. This is significantly worse than average.
| City: | 113 |
| U.S.: | 73 |
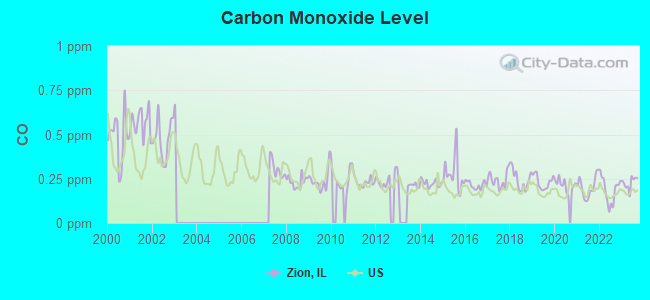
Carbon Monoxide (CO) [ppm] level in 2023 was 0.227. This is about average. Closest monitor was 3.9 miles away from the city center.
| City: | 0.227 |
| U.S.: | 0.251 |

Nitrogen Dioxide (NO2) [ppb] level in 2015 was 9.71. This is significantly worse than average. Closest monitor was 1.8 miles away from the city center.
| City: | 9.71 |
| U.S.: | 5.11 |
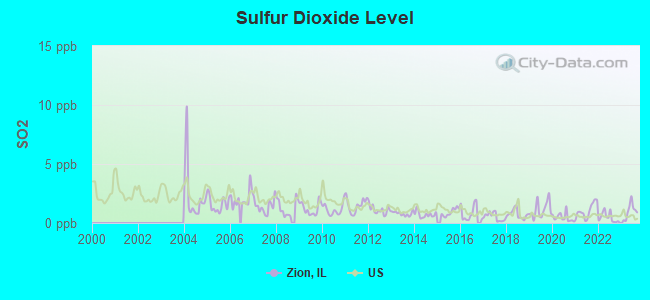
Sulfur Dioxide (SO2) [ppb] level in 2023 was 0.912. This is significantly better than average. Closest monitor was 4.6 miles away from the city center.
| City: | 0.912 |
| U.S.: | 1.515 |
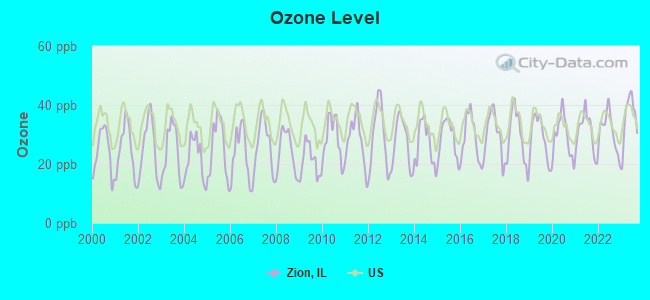
Ozone [ppb] level in 2023 was 35.6. This is about average. Closest monitor was 4.6 miles away from the city center.
| City: | 35.6 |
| U.S.: | 33.3 |
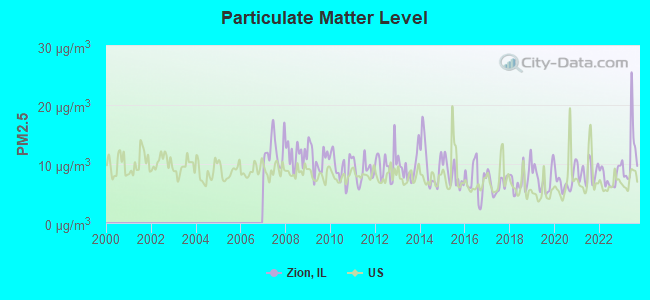
Particulate Matter (PM2.5) [µg/m3] level in 2023 was 11.6. This is significantly worse than average. Closest monitor was 1.8 miles away from the city center.
| City: | 11.6 |
| U.S.: | 8.1 |
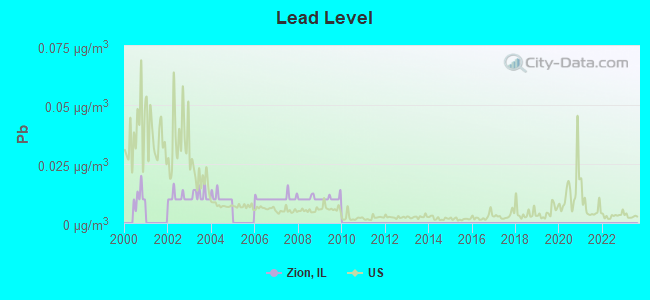
Lead (Pb) [µg/m3] level in 2009 was 0.0105. This is about average. Closest monitor was 4.6 miles away from the city center.
| City: | 0.0105 |
| U.S.: | 0.0093 |
Tornado activity:
Zion-area historical tornado activity is slightly below Illinois state average. It is 20% greater than the overall U.S. average.
On 9/28/1972, a category F4 (max. wind speeds 207-260 mph) tornado 5.8 miles away from the Zion city center injured 20 people and caused between $500,000 and $5,000,000 in damages.
On 4/21/1967, a category F4 tornado 20.9 miles away from the city center killed one person and injured 100 people and caused between $500,000 and $5,000,000 in damages.
Earthquake activity:
Zion-area historical earthquake activity is significantly above Illinois state average. It is 23% greater than the overall U.S. average.On 4/18/2008 at 09:36:59, a magnitude 5.4 (5.1 MB, 4.8 MS, 5.4 MW, 5.2 MW, Class: Moderate, Intensity: VI - VII) earthquake occurred 276.8 miles away from Zion center
On 6/10/1987 at 23:48:54, a magnitude 5.1 (4.9 MB, 4.4 MS, 4.6 MS, 5.1 LG) earthquake occurred 251.2 miles away from Zion center
On 4/18/2008 at 09:36:59, a magnitude 5.2 (5.2 MW, Depth: 8.9 mi) earthquake occurred 276.8 miles away from the city center
On 6/28/2004 at 06:10:52, a magnitude 4.2 (4.2 MW, Depth: 6.2 mi, Class: Light, Intensity: IV - V) earthquake occurred 87.7 miles away from Zion center
On 5/2/2015 at 16:23:07, a magnitude 4.2 (4.2 MW, Depth: 2.8 mi) earthquake occurred 124.2 miles away from the city center
On 2/10/2010 at 09:59:35, a magnitude 3.8 (3.8 MW, Depth: 6.2 mi, Class: Light, Intensity: II - III) earthquake occurred 47.5 miles away from the city center
Magnitude types: regional Lg-wave magnitude (LG), body-wave magnitude (MB), surface-wave magnitude (MS), moment magnitude (MW)
Natural disasters:
The number of natural disasters in Lake County (16) is near the US average (15).Major Disasters (Presidential) Declared: 10
Emergencies Declared: 5
Causes of natural disasters: Storms: 9, Floods: 7, Tornadoes: 3, Snows: 2, Snowstorms: 2, Winter Storms: 2, Blizzard: 1, Hurricane: 1, Wind: 1, Other: 1 (Note: some incidents may be assigned to more than one category).
Hospitals and medical centers in Zion:
- MIDWESTERN REGION MED CENTER (Proprietary, 2520 ELISHA AVENUE)
- GREENPATH HEALTH GROUP, LLC (3232 SHERIDAN ROAD)
- ARBOR VIEW NURSING AND REHAB CENTER (1805 27TH STREET)
- GROVE AT THE LAKE LIVING AND REHABILITATION (2534 ELIM AVENUE)
- ROLLING HILLS MANOR (3615 16TH STREET)
- SHERIDAN HEALTHCARE CENTER (2534 ELIM AVE)
Airports located in Zion:
- Herbert C Maas Airport (IL02) (Runways: 1)
Nuclear power plants:
- Zion 1. Westinghouse Electric Corp.Sargent & Lundy Engineers. Westinghouse Electric Corp.Commonwealth Edison Co.Pressurized Water Reactor (PWR). Net Output: 1040 MWe. Permanently shutdown. Date started: 06/1973. Date closed : 12/1973..
- Zion 2. Westinghouse Electric Corp.Sargent & Lundy Engineers. Westinghouse Electric Corp.Commonwealth Edison Co.Pressurized Water Reactor (PWR). Net Output: 1040 MWe. Permanently shutdown. Date started: 12/1973. Date closed : 09/1974..
Colleges/universities with over 2000 students nearest to Zion:
- Gateway Technical College (about 11 miles; Kenosha, WI; Full-time enrollment: 5,089)
- College of Lake County (about 12 miles; Grayslake, IL; FT enrollment: 11,041)
- Carthage College (about 12 miles; Kenosha, WI; FT enrollment: 3,130)
- University of Wisconsin-Parkside (about 14 miles; Kenosha, WI; FT enrollment: 3,843)
- Oakton Community College (about 28 miles; Des Plaines, IL; FT enrollment: 7,271)
- Harper College (about 29 miles; Palatine, IL; FT enrollment: 10,800)
- Northwestern University (about 29 miles; Evanston, IL; FT enrollment: 17,473)
Public high schools in Zion:
- ZION-BENTON TWNSHP HI SCH (Students: 2,698, Location: 1 ZB WAY, Grades: 9-12)
- ROE ALTERNATIVE PROG OF LAKE CO (Students: 26, Location: 1620 23RD ST, Grades: 6-12)
- NEW TECH HIGH - ZION-BENTON EAST (Location: 1634 23RD ST, Grades: 9-12)
Public elementary/middle schools in Zion:
- SHILOH PARK ELEM SCHOOL (Students: 469, Location: 2635 GABRIEL AVE, Grades: KG-6)
- BEULAH PARK ELEM SCHOOL (Students: 390, Location: 1910 GILBOA AVE, Grades: KG-6)
- EAST ELEMENTARY SCHOOL (Students: 320, Location: 2913 ELIM AVE, Grades: KG-6)
- ZION CENTRAL MIDDLE SCHOOL (Location: 1716 27TH ST, Grades: 7-8)
- ELMWOOD ELEM SCHOOL (Location: 3025 EZRA AVE, Grades: KG-6)
- WEST ELEMENTARY SCHOOL (Location: 2412 JETHRO AVE, Grades: KG-6)
Private elementary/middle school in Zion:
Library in Zion:
- ZION-BENTON PUBLIC LIBRARY DISTRICT (Operating income: $2,268,591; Location: 2400 GABRIEL AVENUE; 123,350 books; 7,463 audio materials; 9,957 video materials; 5 local licensed databases; 16 state licensed databases; 1 other licensed databases; 152 print serial subscriptions; 2 electronic serial subscriptions)
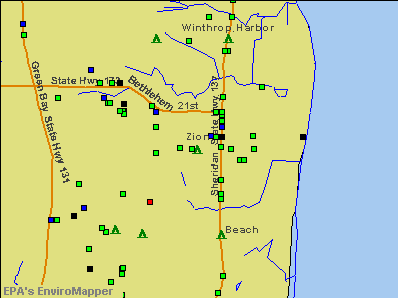
Points of interest:
Notable locations in Zion: Anderson Farm Orchard (A), Zion Auditorium (B), Zion-Benton Public Library (C), Zion City Hall (D), Zion Fire and Rescue Department Station 1 (E), Zion Fire and Rescue Department Station 2 (F). Display/hide their locations on the map
Churches in Zion include: Ahmadiyya Movement In Islam (A), Christian Faith Fellowship Church (B), Church of God (C), Grace Missionary Church (D), Memorial United Methodist Church (E), Mount Zion Missionary Baptist Church (F), New Life Alliance Church (G), Zion Bible Church (H), Christian Church (I). Display/hide their locations on the map
Cemeteries: Lake Mound Cemetery (1), Mount Oliver Memorial Park (2). Display/hide their locations on the map
Creek: Kellogg Creek (A). Display/hide its location on the map
Parks in Zion include: Meadow Creek Park (1), Shiloh Park (2), Carmel Park (3), Edina Park (4), Timothy Park (5), Sharon Park (6), Lorelei Acres Park (7), Lebanon Park (8), Joanna Park (9). Display/hide their locations on the map
Hotels: Country Inn & Suites (1100 33rd Street), Emanuelson Inn Bed & Breakfast (1241 Shiloh Boulevard), American Inn Motel (39018 North Sheridan Road).
Birthplace of: Gary Coleman - (born 1968), television personality, James Gordon Lindsay - Christian missionary, John Hammond (basketball) - Basketball player-coach, Richard Bull (actor) - Actor, Russell Nype - Baritone.
Drinking water stations with addresses in Zion that have no violations reported:
- PINSTERS BOWL AND BAR (Population served: 154, Primary Water Source Type: Groundwater)
- FRITZS CORNER (Population served: 80, Primary Water Source Type: Groundwater)
| This city: | 3.0 people |
| Illinois: | 2.6 people |
| This city: | 72.5% |
| Whole state: | 65.8% |
| This city: | 6.7% |
| Whole state: | 6.3% |
Likely homosexual households (counted as self-reported same-sex unmarried-partner households)
- Lesbian couples: 0.3% of all households
- Gay men: 0.1% of all households
People in group quarters in Zion in 2010:
- 380 people in nursing facilities/skilled-nursing facilities
- 48 people in group homes intended for adults
- 9 people in other noninstitutional facilities
People in group quarters in Zion in 2000:
- 445 people in nursing homes
- 40 people in homes for the mentally ill
- 27 people in religious group quarters
- 15 people in homes or halfway houses for drug/alcohol abuse
- 11 people in other noninstitutional group quarters
- 8 people in homes for the mentally retarded
Banks with branches in Zion (2011 data):
- Guaranty Bank: Zion Branch at 4000 Route 173, branch established on 2002/01/10. Info updated 2011/07/21: Bank assets: $1,179.1 mil, Deposits: $1,102.7 mil, headquarters in Milwaukee, WI, negative income in the last year, Mortgage Lending Specialization, 166 total offices
- Firstmerit Bank, National Association: Zion Branch at 2580 Sheridan Road, branch established on 1999/03/15. Info updated 2010/05/17: Bank assets: $14,420.6 mil, Deposits: $11,497.6 mil, headquarters in Akron, OH, positive income, Commercial Lending Specialization, 213 total offices, Holding Company: Firstmerit Corporation
- TCF National Bank: Zion Jewel Branch at 1400 21st Street, branch established on 2001/04/05. Info updated 2009/11/23: Bank assets: $19,007.0 mil, Deposits: $12,377.0 mil, headquarters in Sioux Falls, SD, positive income, Commercial Lending Specialization, 441 total offices, Holding Company: Tcf Financial Corporation
- PNC Bank, National Association: Zion Branch at 2900 Sheridan Road, branch established on 1909/01/01. Info updated 2012/03/20: Bank assets: $263,309.6 mil, Deposits: $197,343.0 mil, headquarters in Wilmington, DE, positive income, Commercial Lending Specialization, 3085 total offices, Holding Company: Pnc Financial Services Group, Inc., The
- First Midwest Bank: Zion Facility at 3303 Sheridan Road, branch established on 1971/12/07. Info updated 2011/12/22: Bank assets: $7,848.0 mil, Deposits: $6,529.2 mil, headquarters in Itasca, IL, positive income, Commercial Lending Specialization, 100 total offices, Holding Company: First Midwest Bancorp, Inc.
For population 15 years and over in Zion:
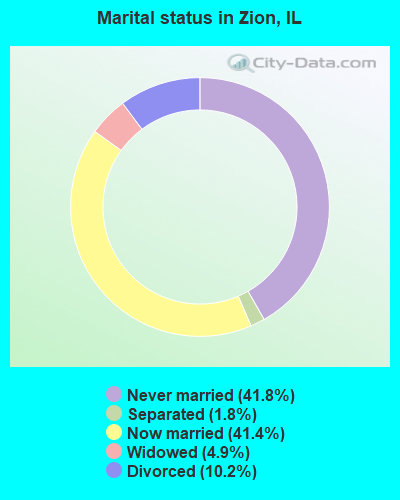
- Never married: 41.8%
- Now married: 41.4%
- Separated: 1.8%
- Widowed: 4.9%
- Divorced: 10.2%
For population 25 years and over in Zion:
- High school or higher: 84.4%
- Bachelor's degree or higher: 17.0%
- Graduate or professional degree: 6.1%
- Unemployed: 6.0%
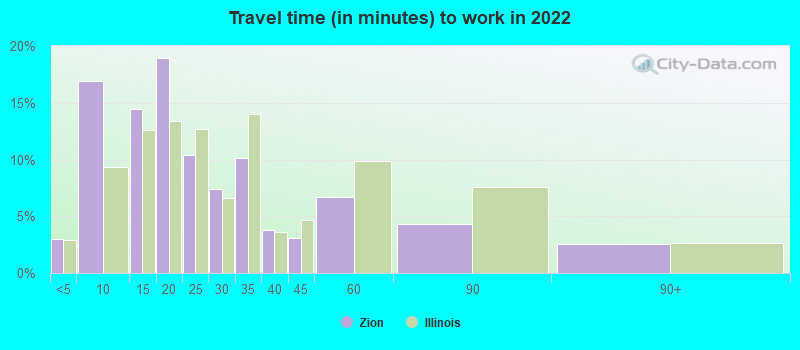
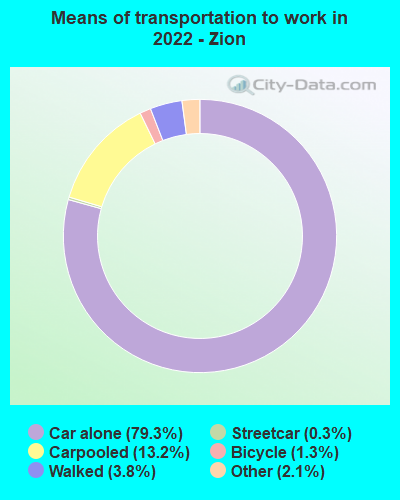
- Mean travel time to work (commute): 25.6 minutes

| Here: | 15.0 |
| Illinois average: | 12.5 |
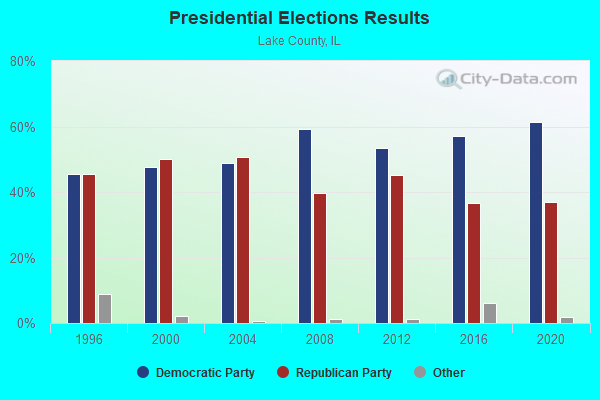
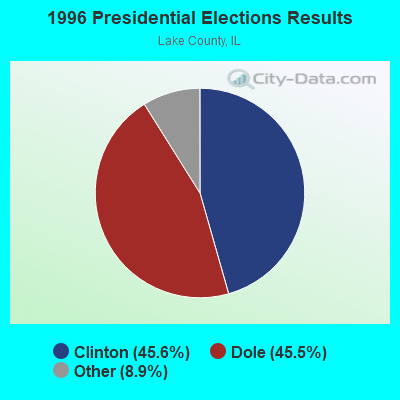
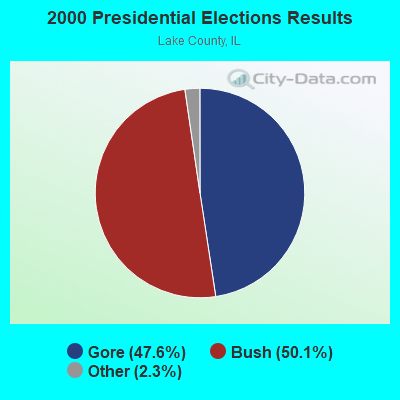
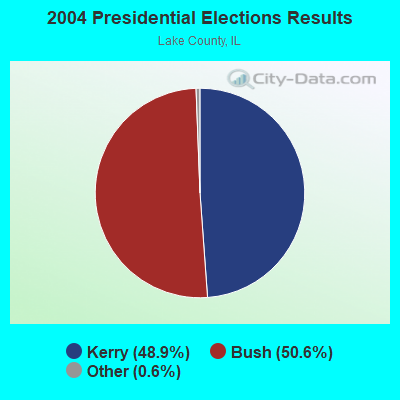
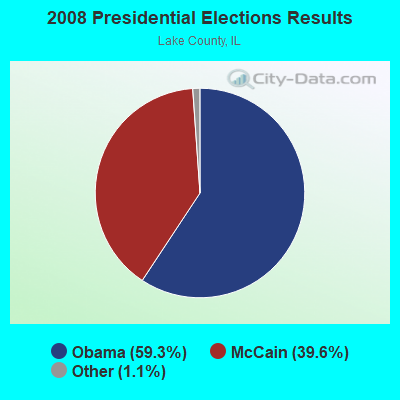
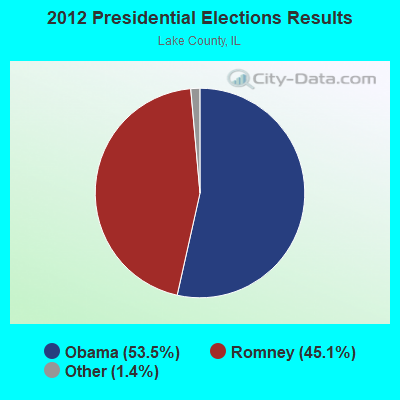
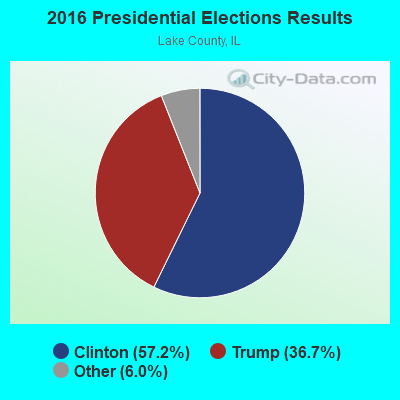
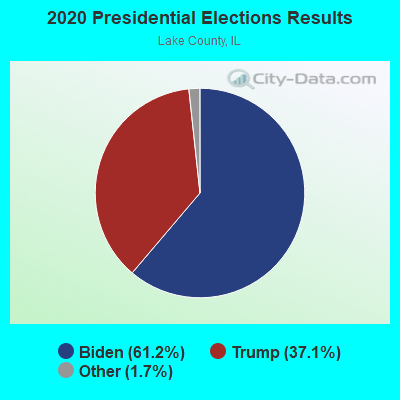
Graphs represent county-level data. Detailed 2008 Election Results
Religion statistics for Zion, IL (based on Lake County data)

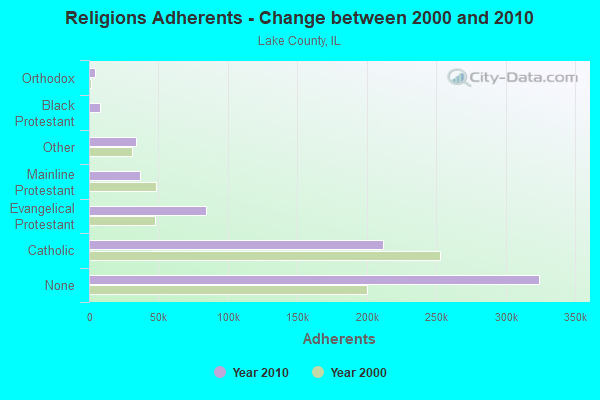
| Religion | Adherents | Congregations |
|---|---|---|
| Catholic | 211,380 | 29 |
| Evangelical Protestant | 84,501 | 211 |
| Mainline Protestant | 36,967 | 76 |
| Other | 33,822 | 62 |
| Black Protestant | 7,824 | 16 |
| Orthodox | 4,610 | 8 |
| None | 324,358 | - |
Food Environment Statistics:
| Lake County: | 1.71 / 10,000 pop. |
| State: | 2.24 / 10,000 pop. |
| Lake County: | 0.06 / 10,000 pop. |
| State: | 0.08 / 10,000 pop. |
| This county: | 0.54 / 10,000 pop. |
| Illinois: | 0.75 / 10,000 pop. |
| Lake County: | 2.46 / 10,000 pop. |
| State: | 2.61 / 10,000 pop. |
| This county: | 6.47 / 10,000 pop. |
| Illinois: | 6.86 / 10,000 pop. |
| Here: | 7.3% |
| Illinois: | 8.3% |
| Here: | 24.2% |
| State: | 25.2% |
| This county: | 16.3% |
| Illinois: | 14.5% |
Health and Nutrition:
| Zion: | 47.3% |
| State: | 49.5% |
| Zion: | 45.1% |
| Illinois: | 47.2% |
| This city: | 29.1 |
| Illinois: | 28.6 |
| Zion: | 20.8% |
| Illinois: | 20.5% |
| Zion: | 11.5% |
| Illinois: | 10.8% |
| Zion: | 6.7 |
| State: | 6.8 |
| Zion: | 34.1% |
| Illinois: | 33.4% |
| Here: | 55.1% |
| Illinois: | 56.4% |
| Here: | 80.9% |
| Illinois: | 79.9% |
More about Health and Nutrition of Zion, IL Residents
| Local government employment and payroll (March 2022) | |||||
| Function | Full-time employees | Monthly full-time payroll | Average yearly full-time wage | Part-time employees | Monthly part-time payroll |
|---|---|---|---|---|---|
| Police Protection - Officers | 41 | $395,368 | $115,717 | 0 | $0 |
| Firefighters | 24 | $197,941 | $98,971 | 9 | $5,879 |
| Streets and Highways | 15 | $85,530 | $68,424 | 0 | $0 |
| Other and Unallocable | 6 | $36,210 | $72,420 | 2 | $1,845 |
| Water Supply | 6 | $34,049 | $68,098 | 1 | $919 |
| Financial Administration | 4 | $29,789 | $89,367 | 1 | $1,095 |
| Police - Other | 4 | $19,403 | $58,209 | 4 | $4,129 |
| Other Government Administration | 2 | $13,932 | $83,592 | 7 | $10,172 |
| Fire - Other | 0 | $0 | 2 | $3,132 | |
| Totals for Government | 102 | $812,221 | $95,555 | 26 | $27,173 |
Zion government finances - Expenditure in 2018 (per resident):
- Construction - Regular Highways: $274,000 ($11.27)
Water Utilities: $179,000 ($7.36)
Police Protection: $85,000 ($3.50)
- Current Operations - Police Protection: $9,279,000 ($381.62)
Local Fire Protection: $5,084,000 ($209.09)
Water Utilities: $3,695,000 ($151.96)
General - Other: $3,590,000 ($147.65)
Regular Highways: $2,695,000 ($110.84)
Central Staff Services: $1,377,000 ($56.63)
Protective Inspection and Regulation - Other: $751,000 ($30.89)
Financial Administration: $745,000 ($30.64)
General Public Buildings: $171,000 ($7.03)
- General - Interest on Debt: $3,192,000 ($131.28)
- Intergovernmental to Local - Other - General - Other: $168,000 ($6.91)
- Total Salaries and Wages: $10,978,000 ($451.49)
Zion government finances - Revenue in 2018 (per resident):
- Charges - Solid Waste Management: $2,103,000 ($86.49)
Other: $1,703,000 ($70.04)
- Federal Intergovernmental - Public Welfare: $9,000 ($0.37)
- Local Intergovernmental - Other: $18,000 ($0.74)
- Miscellaneous - Fines and Forfeits: $637,000 ($26.20)
General Revenue - Other: $311,000 ($12.79)
Interest Earnings: $36,000 ($1.48)
- Revenue - Water Utilities: $4,853,000 ($199.59)
- State Intergovernmental - General Local Government Support: $5,727,000 ($235.53)
Highways: $724,000 ($29.78)
- Tax - Property: $9,886,000 ($406.58)
Other License: $3,837,000 ($157.80)
Public Utilities Sales: $1,538,000 ($63.25)
Other Selective Sales: $321,000 ($13.20)
Zion government finances - Debt in 2018 (per resident):
- Long Term Debt - Beginning Outstanding - Unspecified Public Purpose: $78,231,000 ($3217.40)
Outstanding Unspecified Public Purpose: $59,247,000 ($2436.64)
Retired Unspecified Public Purpose: $18,984,000 ($780.75)
Zion government finances - Cash and Securities in 2018 (per resident):
- Other Funds - Cash and Securities: $6,986,000 ($287.31)
6.06% of this county's 2021 resident taxpayers lived in other counties in 2020 ($110,528 average adjusted gross income)
| Here: | 6.06% |
| Illinois average: | 5.09% |
0.03% of residents moved from foreign countries ($301 average AGI)
Lake County: 0.03% Illinois average: 0.01%
Top counties from which taxpayers relocated into this county between 2020 and 2021:
| from Cook County, IL | |
| from McHenry County, IL | |
| from DuPage County, IL |
6.71% of this county's 2020 resident taxpayers moved to other counties in 2021 ($163,220 average adjusted gross income)
| Here: | 6.71% |
| Illinois average: | 6.10% |
0.04% of residents moved to foreign countries ($308 average AGI)
Lake County: 0.04% Illinois average: 0.01%
Top counties to which taxpayers relocated from this county between 2020 and 2021:
| to Cook County, IL | |
| to McHenry County, IL | |
| to Kenosha County, WI |
| Businesses in Zion, IL | ||||
| Name | Count | Name | Count | |
|---|---|---|---|---|
| 7-Eleven | 1 | FedEx | 4 | |
| ALDI | 1 | H&R Block | 1 | |
| Ace Hardware | 1 | Jewel-Osco | 1 | |
| Advance Auto Parts | 1 | KFC | 1 | |
| Applebee's | 1 | Kmart | 1 | |
| AutoZone | 1 | McDonald's | 1 | |
| Baskin-Robbins | 1 | Nike | 2 | |
| Burger King | 1 | RadioShack | 1 | |
| CVS | 1 | Subway | 4 | |
| Cricket Wireless | 2 | T-Mobile | 1 | |
| Curves | 1 | Taco Bell | 1 | |
| DHL | 1 | UPS | 2 | |
| Dairy Queen | 1 | Walgreens | 1 | |
| Domino's Pizza | 1 | Walmart | 1 | |
| Dunkin Donuts | 1 | Wendy's | 1 | |
Strongest AM radio stations in Zion:
- WTMJ (620 AM; 50 kW; MILWAUKEE, WI; Owner: JOURNAL BROADCAST CORPORATION)
- WISN (1130 AM; 50 kW; MILWAUKEE, WI; Owner: CAPSTAR TX LIMITED PARTNERSHIP)
- WGN (720 AM; 50 kW; CHICAGO, IL; Owner: WGN CONTINENTAL BROADCASTING CO.)
- WBBM (780 AM; 50 kW; CHICAGO, IL; Owner: INFINITY BROADCASTING OPERATIONS, INC.)
- WSCR (670 AM; 50 kW; CHICAGO, IL; Owner: INFINITY BROADCASTING OPERATIONS, INC.)
- WMVP (1000 AM; 50 kW; CHICAGO, IL; Owner: ABC, INC.)
- WPJX (1500 AM; daytime; 0 kW; ZION, IL)
- WKRS (1220 AM; 1 kW; WAUKEGAN, IL; Owner: NM LICENSING, LLC)
- WLS (890 AM; 50 kW; CHICAGO, IL; Owner: WLS, INC.)
- WYLL (1160 AM; 50 kW; CHICAGO, IL; Owner: SCA LICENSE CORPORATION)
- WKTA (1330 AM; 5 kW; EVANSTON, IL; Owner: POLNET COMMUNICATIONS, LTD.)
- WVIV (1200 AM; 20 kW; CHICAGO, IL; Owner: WLXX-AM LICENSE CORP.)
- WNVR (1030 AM; 5 kW; VERNON HILLS, IL; Owner: POLNET COMMUNICATIONS, LTD.)
Strongest FM radio stations in Zion:
- WWDV (96.9 FM; ZION, IL; Owner: BONNEVILLE HOLDING COMPANY)
- WIIL (95.1 FM; KENOSHA, WI; Owner: NM LICENSING, LLC)
- WXLC (102.3 FM; WAUKEGAN, IL; Owner: NM LICENSING, LLC)
- WEZY (92.1 FM; RACINE, WI; Owner: RACINE BROADCASTING, L.L.C.)
- WCKG (105.9 FM; ELMWOOD PARK, IL; Owner: INFINITY HOLDINGS CORPORATION OF ORLANDO)
- WLIT-FM (93.9 FM; CHICAGO, IL; Owner: AMFM RADIO LICENSES, L.L.C.)
- WJMK (104.3 FM; CHICAGO, IL; Owner: INFINITY BROADCASTING CORP. OF ILLINOIS)
- WNUA (95.5 FM; CHICAGO, IL; Owner: AMFM RADIO LICENSES, L.L.C.)
- WGCI-FM (107.5 FM; CHICAGO, IL; Owner: AMFM RADIO LICENSES, L.L.C.)
- WTMX (101.9 FM; SKOKIE, IL; Owner: BONNEVILLE HOLDING COMPANY)
- WBBM-FM (96.3 FM; CHICAGO, IL; Owner: INFINITY BROADCASTING OPERATIONS, INC.)
- WKSC-FM (103.5 FM; CHICAGO, IL; Owner: AMFM RADIO LICENSES, L.L.C.)
- WFMT (98.7 FM; CHICAGO, IL; Owner: WINDOW TO THE WORLD COMMUNICATIONS)
- WZZN (94.7 FM; CHICAGO, IL; Owner: ABC CHICAGO FM RADIO,INC.)
- WBEZ (91.5 FM; CHICAGO, IL; Owner: THE WBEZ ALLIANCE, INC.)
- WKQX (101.1 FM; CHICAGO, IL; Owner: EMMIS RADIO LICENSE CORPORATION)
- WLUP-FM (97.9 FM; CHICAGO, IL; Owner: BONNEVILLE HOLDING COMPANY)
- WNND (100.3 FM; CHICAGO, IL; Owner: BONNEVILLE HOLDING COMPANY)
- WOJO (105.1 FM; EVANSTON, IL; Owner: TICHENOR LICENSE CORPORATION ("TLC"))
- WUSN (99.5 FM; CHICAGO, IL; Owner: INFINITY BROADCASTING CORPORATION OF CHICAGO)
TV broadcast stations around Zion:
- W64CQ (Channel 64; ARLINGTON HEIGHTS, IL; Owner: TRINITY BROADCASTING NETWORK)
- W34CK (Channel 34; ARLINGTON HEIGHTS, IL; Owner: FIRST UNITED, INC.)
- WLS-TV (Channel 7; CHICAGO, IL; Owner: WLS TELEVISION, INC.)
- WMAQ-TV (Channel 5; CHICAGO, IL; Owner: NBC SUBSIDIARY (WMAQ-TV), INC.)
- WTTW (Channel 11; CHICAGO, IL; Owner: WINDOW TO THE WORLD COMMUNICATIONS, INC.)
- WGBO-TV (Channel 66; JOLIET, IL; Owner: WGBO LICENSE PARTNERSHIP, G.P.)
- WGN-TV (Channel 9; CHICAGO, IL; Owner: WGN CONTINENTAL BROADCASTING COMPANY)
- WBBM-TV (Channel 2; CHICAGO, IL; Owner: CBS BROADCASTING INC.)
- WJJA (Channel 49; RACINE, WI; Owner: TV-49, INC.)
- WPWR-TV (Channel 50; GARY, IN; Owner: FOX TELEVISION STATIONS, INC.)
- WXFT (Channel 60; AURORA, IL; Owner: TELEFUTURA CHICAGO LLC)
- WCIU-TV (Channel 26; CHICAGO, IL; Owner: WCIU-TV LIMITED PARTNERSHIP)
- WCPX (Channel 38; CHICAGO, IL; Owner: PAXSON CHICAGO LICENSE, INC.)
- WSNS-TV (Channel 44; CHICAGO, IL; Owner: TELEMUNDO OF CHICAGO, INC.)
- WFLD (Channel 32; CHICAGO, IL; Owner: FOX TELEVISION STATIONS, INC.)
- W68DO (Channel 68; PALATINE, IL; Owner: TRINITY BROADCASTING NETWORK)
- WFBT-CA (Channel 23; CHICAGO, IL; Owner: CHANNEL 23 LIMITED PARTNERSHIP)
- WJYS (Channel 62; HAMMOND, IN; Owner: JOVON BROADCASTING CORPORATION)
- WOCH-LP (Channel 28; CHICAGO, IL; Owner: KM LPTV OF CHICAGO-28, L.L.C.)
- WYCC (Channel 20; CHICAGO, IL; Owner: COLLEGE DIST. #508, COUNTY OF COOK)
- WOCK-CA (Channel 13; CHICAGO, IL; Owner: KM LPTV OF CHICAGO-13, L.L.C.)
- WPXE (Channel 55; KENOSHA, WI; Owner: PAXSON MILWAUKEE LICENSE, INC.)
- WMVS (Channel 10; MILWAUKEE, WI; Owner: MILWAUKEE AREA TECHNICAL COLLEGE DISTRICT BOARD)
- WMVT (Channel 36; MILWAUKEE, WI; Owner: MILWAUKEE AREA TECHNICAL COLLEGE DISTRICT BOARD)
- WISN-TV (Channel 12; MILWAUKEE, WI; Owner: WISN HEARST-ARGYLE TV, INC. (CA CORP.))
- National Bridge Inventory (NBI) Statistics
- 2Number of bridges
- 22,050Total average daily traffic
- 709Total average daily truck traffic
FCC Registered Antenna Towers: 114 (See the full list of FCC Registered Antenna Towers)
FCC Registered Private Land Mobile Towers: 1 (See the full list of FCC Registered Private Land Mobile Towers in Zion, IL)
FCC Registered Broadcast Land Mobile Towers: 36 (See the full list of FCC Registered Broadcast Land Mobile Towers)
FCC Registered Microwave Towers: 16 (See the full list of FCC Registered Microwave Towers in this town)
FCC Registered Paging Towers: 2 (See the full list of FCC Registered Paging Towers)
FCC Registered Amateur Radio Licenses: 174 (See the full list of FCC Registered Amateur Radio Licenses in Zion)
FAA Registered Aircraft: 9 (See the full list of FAA Registered Aircraft in Zion)
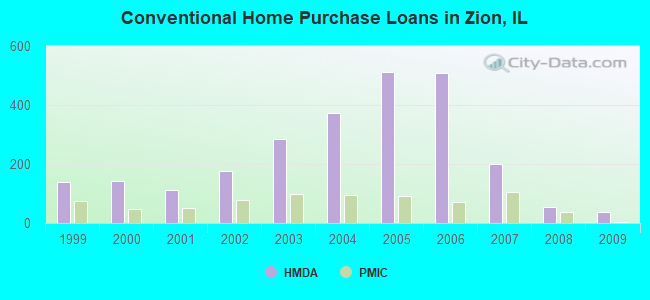
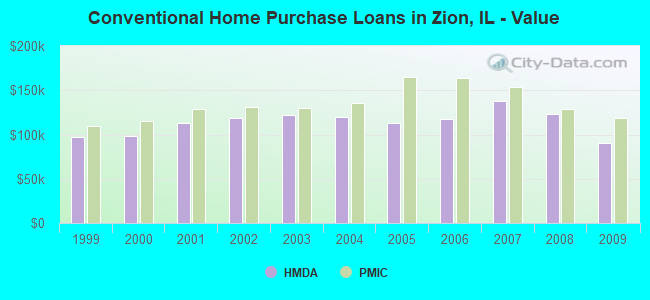
| Home Mortgage Disclosure Act Aggregated Statistics For Year 2009 (Based on 3 full and 4 partial tracts) | ||||||||||||||
| A) FHA, FSA/RHS & VA Home Purchase Loans | B) Conventional Home Purchase Loans | C) Refinancings | D) Home Improvement Loans | E) Loans on Dwellings For 5+ Families | F) Non-occupant Loans on < 5 Family Dwellings (A B C & D) | G) Loans On Manufactured Home Dwelling (A B C & D) | ||||||||
|---|---|---|---|---|---|---|---|---|---|---|---|---|---|---|
| Number | Average Value | Number | Average Value | Number | Average Value | Number | Average Value | Number | Average Value | Number | Average Value | Number | Average Value | |
| LOANS ORIGINATED | 105 | $125,492 | 38 | $90,209 | 256 | $152,208 | 11 | $35,655 | 3 | $161,047 | 30 | $100,828 | 1 | $33,440 |
| APPLICATIONS APPROVED, NOT ACCEPTED | 12 | $122,951 | 4 | $71,958 | 49 | $151,672 | 6 | $40,820 | 0 | $0 | 4 | $96,535 | 0 | $0 |
| APPLICATIONS DENIED | 23 | $161,830 | 15 | $84,082 | 136 | $156,891 | 15 | $57,259 | 1 | $335,000 | 15 | $84,651 | 5 | $47,834 |
| APPLICATIONS WITHDRAWN | 16 | $116,307 | 4 | $99,868 | 80 | $141,887 | 2 | $76,990 | 0 | $0 | 11 | $91,530 | 0 | $0 |
| FILES CLOSED FOR INCOMPLETENESS | 6 | $155,323 | 1 | $60,000 | 28 | $156,510 | 2 | $35,650 | 0 | $0 | 1 | $74,640 | 0 | $0 |
Detailed HMDA statistics for the following Tracts: 8601.01 , 8601.04, 8602.00, 8603.01, 8603.02, 8604.00, 8605.00
| Private Mortgage Insurance Companies Aggregated Statistics For Year 2009 (Based on 3 full and 4 partial tracts) | ||||
| A) Conventional Home Purchase Loans | B) Refinancings | |||
|---|---|---|---|---|
| Number | Average Value | Number | Average Value | |
| LOANS ORIGINATED | 5 | $118,622 | 3 | $153,487 |
| APPLICATIONS APPROVED, NOT ACCEPTED | 5 | $132,090 | 8 | $170,922 |
| APPLICATIONS DENIED | 2 | $134,045 | 1 | $75,370 |
| APPLICATIONS WITHDRAWN | 0 | $0 | 0 | $0 |
| FILES CLOSED FOR INCOMPLETENESS | 0 | $0 | 0 | $0 |
Detailed PMIC statistics for the following Tracts: 8601.01 , 8601.04, 8602.00, 8603.01, 8603.02, 8604.00, 8605.00
2002 - 2018 National Fire Incident Reporting System (NFIRS) incidents
- Fire incident types reported to NFIRS in Zion, IL
- 1,05961.8%Structure Fires
- 45226.4%Outside Fires
- 1599.3%Mobile Property/Vehicle Fires
- 432.5%Other
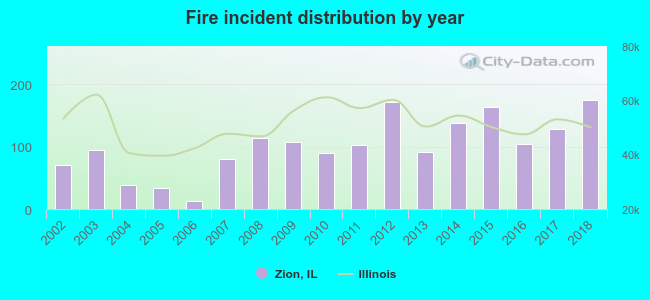 Based on the data from the years 2002 - 2018 the average number of fire incidents per year is 101. The highest number of fire incidents - 174 took place in 2018, and the least - 13 in 2006. The data has a rising trend.
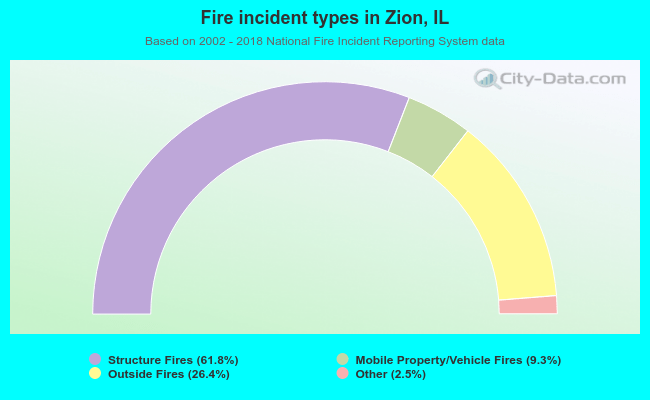 When looking into fire subcategories, the most reports belonged to: Structure Fires (61.8%), and Outside Fires (26.4%).
Fire-safe hotels and motels in Zion, Illinois:
- Country Inn & Suites By Carlson, 1100 33rd St, Zion, Illinois 60099 , Phone: (847) 746-0101, Fax: (847) 746-0202
- Best Western Plus The Inn And Suites At Market Square, 2723 Sheridan Rd, Zion, Illinois 60099 , Phone: (847) 872-4000, Fax: (847) 872-2378
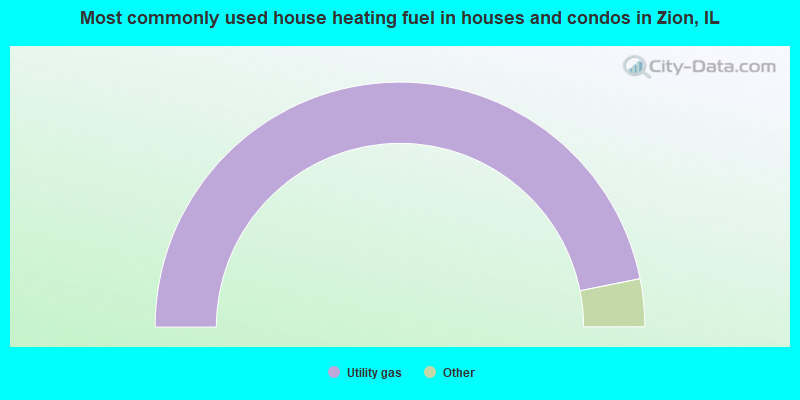
- 93.7%Utility gas
- 3.9%Electricity
- 2.5%Bottled, tank, or LP gas
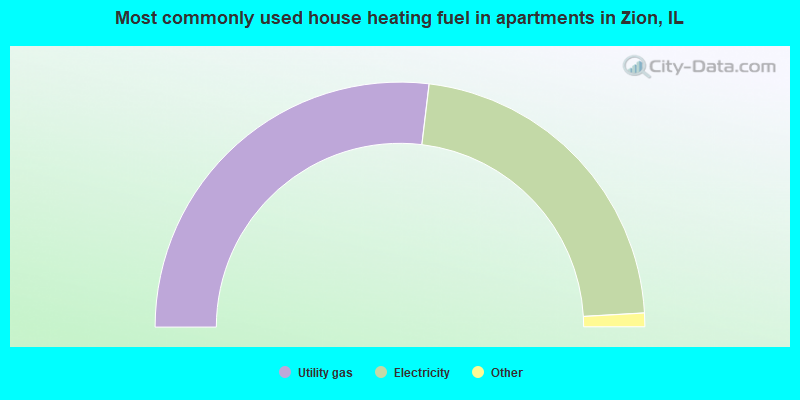
- 53.8%Utility gas
- 44.4%Electricity
- 0.8%No fuel used
- 0.7%Bottled, tank, or LP gas
- 0.3%Other fuel
Zion compared to Illinois state average:
- Unemployed percentage below state average.
- Hispanic race population percentage above state average.
- Median age significantly below state average.
- Length of stay since moving in above state average.
- Percentage of population with a bachelor's degree or higher below state average.
Zion on our top lists:
- #32 on the list of "Top 101 cities with largest percentage of males in occupations: office and administrative support occupations (population 5,000+)"
- #60 on the list of "Top 101 cities with the highest number of rapes per 100,000 residents, excludes tourist destinations and others with a lot of outsiders visiting based on city industries data (population 5,000+)"
- #4 on the list of "Top 101 counties with the highest average weight of females"
- #22 on the list of "Top 101 counties with the largest decrease in the number of births per 1000 residents 2000-2006 to 2007-2013 (pop 50,000+)"
- #24 on the list of "Top 101 counties with the largest increase in the number of infant deaths per 1000 residents 2000-2006 to 2007-2013 (pop. 50,000+)"
- #29 on the list of "Top 101 counties with the highest percentage of residents that exercised in the past month"
- #31 on the list of "Top 101 counties with the largest number of people moving out compared to moving in (pop. 50,000+)"

|
|
Total of 70 patent applications in 2008-2024.